Identifying and Diagnosing Memory Issues in the JVM
This section takes the example of the sapclient application again to demonstrate the effectiveness of the eG JVM Monitor in proactively detecting and alerting administrators to memory contentions experienced by Java applications.
If the usage of a memory pool increases, the eG JVM Monitor indicates the same using the Used memory measure for that pool reported by the JVM Memory Usage test mapped to the JVM Engine layer.
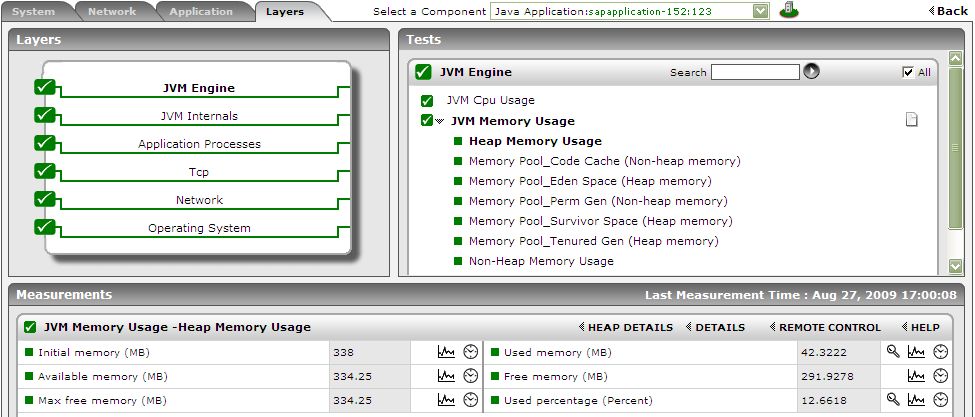
Figure 1 : The Used memory measure indicating the amount of pool memory being utilized
To know which class is consuming memory excessively, click on the diagnosis icon corresponding to the Used memory measure in Figure 1. Figure 2 then appears listing all the classes that are using the pool memory, the amount and percentage of memory used by each class, the number of instances of each class that is currently operational, and also the percentage of currently running instances of each class. Since this list is by default sorted in the descending order of the percentage memory usage, the first class in the list will obviously be the leading memory consumer. In the case of our example, the memory contention in the sapbusiness application has been caused by the 22% heap memory usage of the com.ibc.object.SapBusinessObject class.
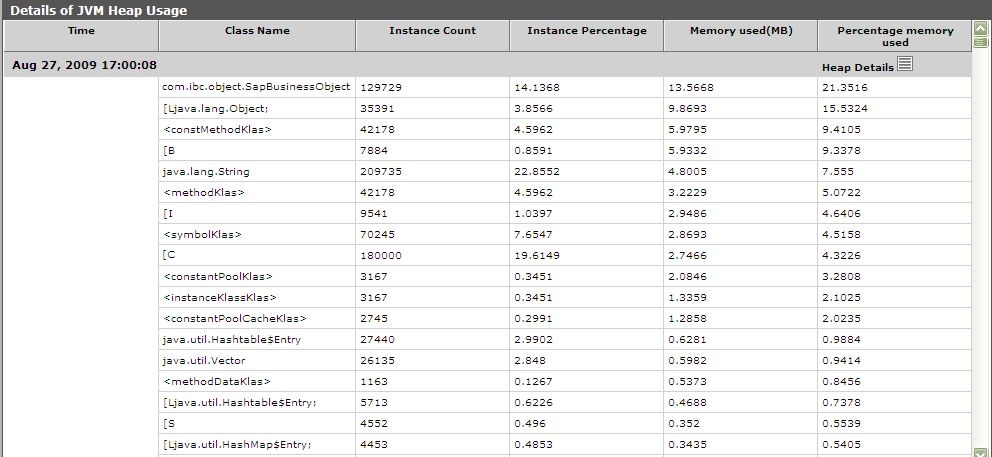
Figure 2 : The detailed diagnosis of the Used memory measure
Sometimes, you might want to sort the classes by another column or quickly switch to another measurement period to analyze the memory usage during that time frame. To achieve this, click on the Heap Details link or the  button next to it. Figure 53 then appears, allowing you the flexibility to view memory-consuming classes based on a Sort by option and a Measurement Time of your choice.
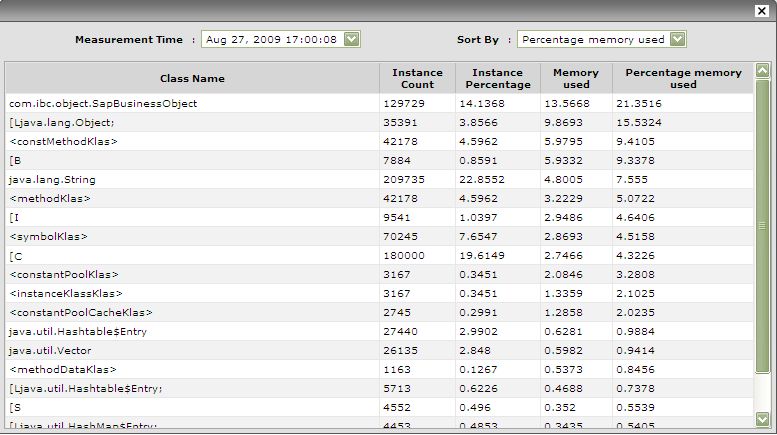
Figure 3 : Choosing a different Sory By option and Measurement Time
Careful examination of the method that calls the SapBusinessObject (see Figure 4) reveals that an endless while loop is causing an array list named a to be populated with 20,000 instances of the SapBusinessObject, every 10 seconds! The continuous addition of objects is quiet obviously depleting the memory available to the JVM.
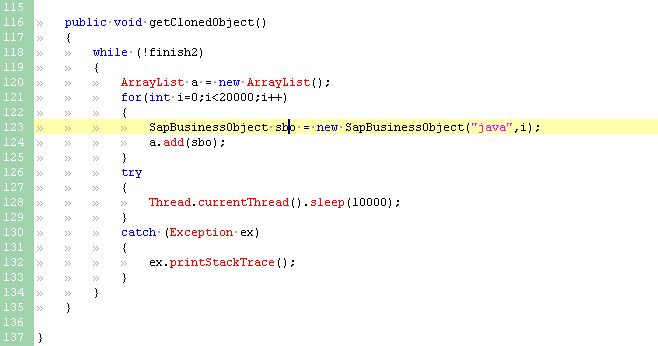
Figure 4 : The method that is invoking the SapBusinessObject
This is how the eG JVM Monitor greatly simplifies the process of identifying the source of memory bottlenecks in a Java application.