Java Application Monitoring
The prime concern of administrators of Java applications is knowing how well the application is functioning, and how to troubleshoot issues (if any) in the performance of these applications. There can be several reasons why a Java application may be slow (see Figure 1) and accurate diagnosis of the problem is critical to resolve the application slowness issue.
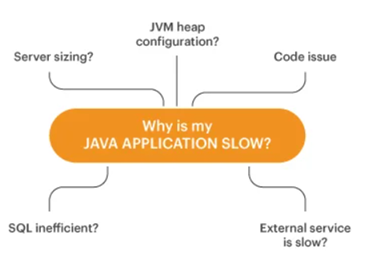
Figure 1 : There may be many reasons why a Java application is slow
Full stack visibility is essential for Java application monitoring. Slowness in the Java virtual machine (JVM) or in the web application server hosting the application can result in Java application slowness. Code level issues in the Java application may also affect the application’s performance. Hence, what is needed is:
Most web application server vendors prescribe custom APIs for monitoring – for instance, WebSphere and WebLogic allow administrators to use their built-in APIs for performance monitoring and problem detection.
In some cases, you might have to support stand-alone Java applications(i.e., when the Java application doesn’t rely on a web application server). For monitoring the overall health of stand-alone Java applications, eG Enterprise offers a generic monitoring model called the Java Application.
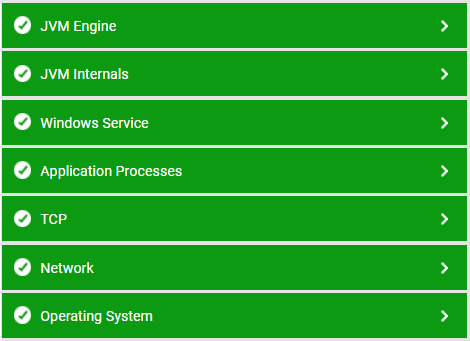
Figure 2 : Layer model of the Java Application
Each layer of Figure 2 above is mapped to a series of tests that report critical statistics pertaining to the Java application being monitored. Since standalone Java applications are not web-based, monitoring of Java application servers and transactions is not included in this model. Using these statistics, administrators can figure out the following:
- Has the Java heap been sized properly? (i.e., is the Xmx parameter value properly set)
- How effective is garbage collection? Is it impacting application performance? Is Java garbage collection taking too long (and possibly affecting the Java application’s performance)?
-
Often, Java programs use threads. A single program may involve multiple concurrent threads running in parallel. Is there excessive blocking between threads due to synchronization issues during application design?
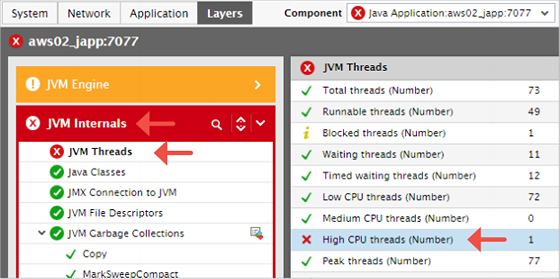
Figure 3 : Diagnosing Java application performance issues
- Are there runaway threads, which are taking too many CPU cycles? If such threads exist, which portions of code are responsible for spawning such threads?
- Is the JVM managing its memory resources efficiently or is the free memory on the JVM very less? Which type of memory is being utilized by the JVM increasingly?
- Has a scheduled JVM restart occurred? If so, when?
Related content: You may find our white paper on Best Practices for Effectively Managing Java Application Performance of interest.