Identifying and Diagnosing a Thread Deadlock Situation in the JVM
In this section, the aws02_japp application is used one more time to explain how the eG JVM Monitor can be used to report on deadlock situations in your JVM, and to diagnose the root-cause of the deadlock.
Until a deadlock situation arises, the Deadlock threads measure reported by the JVM Threads test will report only 0 as its value. When, say 2 threads are deadlocked for a particular resource/object, then the Deadlock threads measure will report the value 2, as depicted by Figure 1.
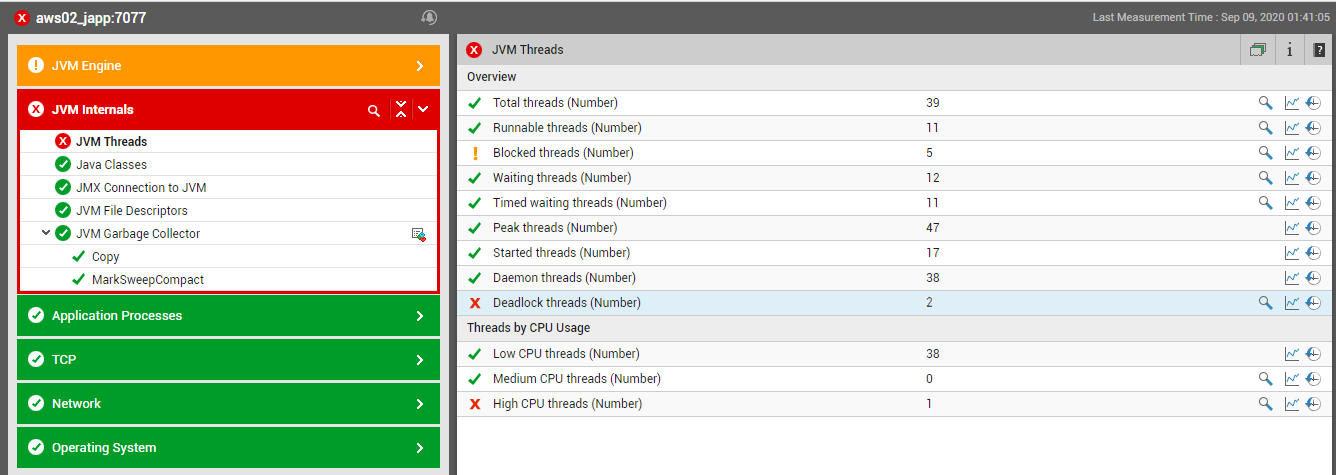
Figure 1 : The JVM Threads test reporting 2 Deadlock threads
To know which threads are in a deadlock, click on the 'magnifying glass' icon corresponding to the Deadlock threads measure. Figure 2 then appears.
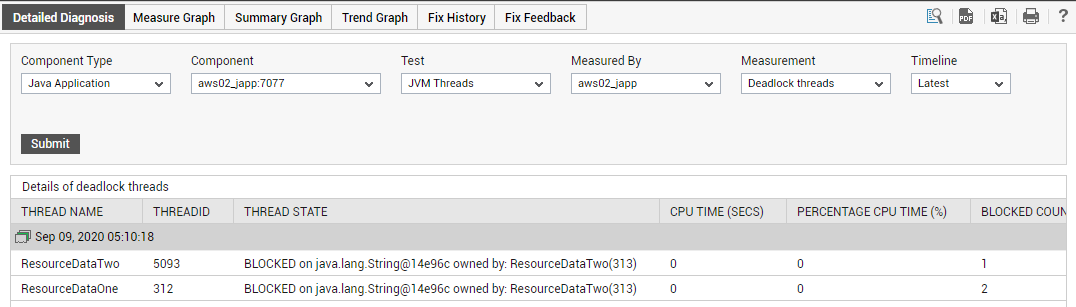
Figure 2 : The detailed diagnosis page revealing the deadlocked threads
Figure 2 clearly reveals that 2 threads, namely – the ResourceDataTwo and the ResourceDataOne thread - are in a deadlock currently. To figure out why these two threads are deadlocked, you would have to carefully review the stack trace of both these threads. For this purpose, scroll to the left of Figure 2 to view the stack trace clearly (see Figure 3)
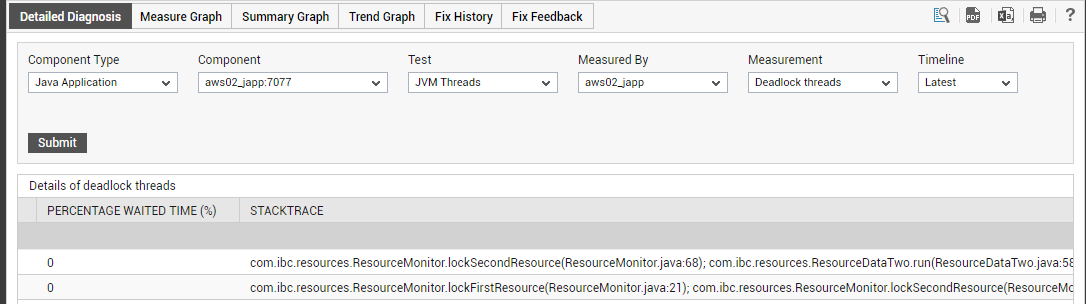
Figure 3 : Viewing the stack trace of the deadlocked threads
To keenly focus on the stack trace, without being distracted by the other columns in Figure 2 and Figure 3, click on the  icon in Figure 2. Figure 4 will then appear.
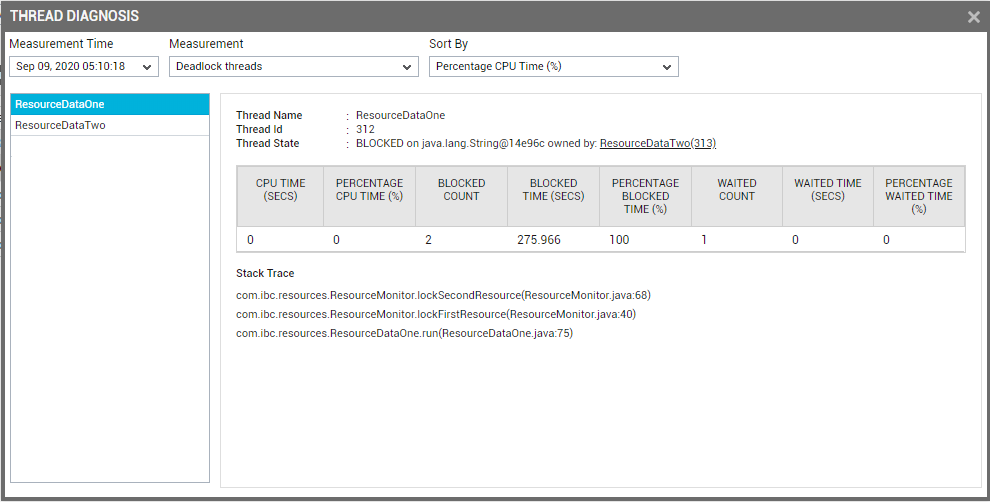
Figure 4 : The stack trace for the ResourceDataOne thread
The left panel of Figure 4 lists the 2 deadlocked threads, with the thread that is the leading CPU consumer being selected by default – in the case of our example, this is the ResourceDataOne thread. For this default selection, the contents of the right panel will be as depicted by Figure 4 above. From the Thread State, it is evident that the ResourceDataOne thread has been blocked on an object that is owned by the ResourceDataTwo thread.
If you closely scrutinize the stack trace of ResourceDataOne, you will uncover that once the thread started running, it executed line 40 of the ResourceMonitor.java program file, which in turn invoked line 68 of the same file; the deadlock appears to have occurred at line 68 only.
Let us now shift our focus to the ResourceDataTwo thread. To view the stack trace of this thread, click on the thread name in the left panel of Figure 4. As you can see in Figure 5, the Thread State clearly indicates that the ResouceDataTwo thread has been blocked by the ResourceDataOne thread. With that, we can conclude that both threads are blocking each other, thus making for an ideal deadlock situation.
Analysis of the stack trace of the ResourceDataTwo thread (see Figure 5) reveals that once started, the thread executed line 94 of the ResourceMonitor.java file, which in turn invoked line 21 of the same file; since no lines of code have been executed subsequently, we can conclude that the deadlock occurred at line 21 only.
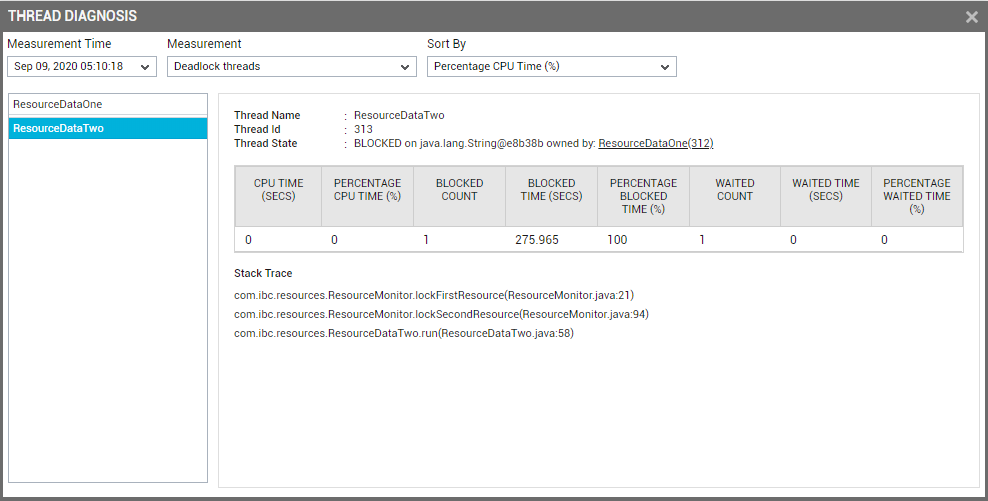
Figure 5 : The stack trace for the ResourceDataTwo thread
From the above discussion, we can infer both the threads deadlocked while attempting to execute code contained within the ResourceMonitor.java file. We now need to examine the code in this file to figure out why the deadlock occurred. Let us therefore open the ResourceMonitor.java file.
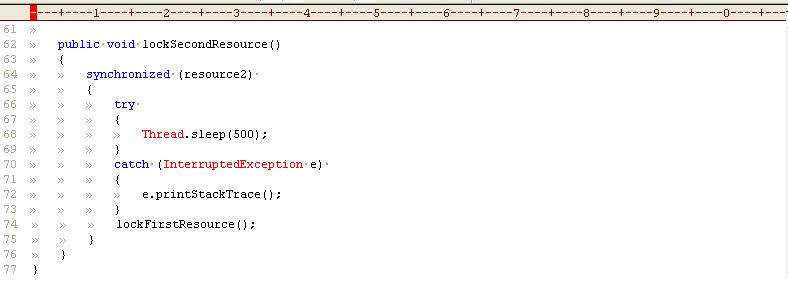
Figure 6 : The lines of code executed by the ResourceDataOne thread
If you can recall, the stack trace of the ResourceDataOne thread indicated a problem while executing the code around line number 68 (see Figure 4) of the ResourceMonitor.java file. Figure 6 depicts this piece of code. According to this code, the ResourceDataOne thread calls a lockSecondResource() method, which in turn invokes a synchronized block that puts the thread to sleep for 500 milliseconds; a synchronized method, when called by a thread, cannot be invoked by any other thread until its original caller releases the method.
Going back to Figure 6, at the end of the sleep duration of 500 milliseconds, the synchronized block will invoke another method named lockFirstResource(). However, note that this method and the lockSecondResource() method are also called by the ResourceDataTwo thread. To verify this, let us proceed to review the lines of code executed by the ResourceDataTwo thread (see Figure 7).
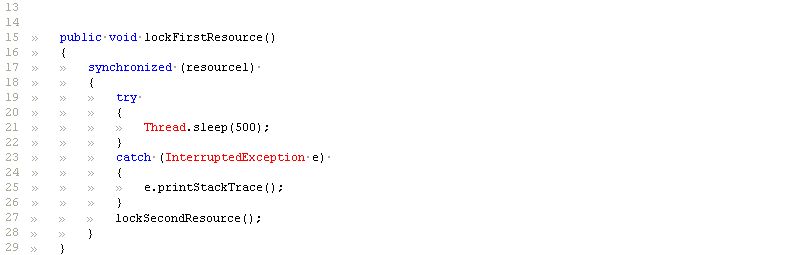
Figure 7 : The lines of code executed by the ResourceDataTwo thread
As per the stack trace corresponding to the ResourceDataTwo thread (see Figure 5), the deadlock creeps in at line 21 of the ResourceMonitor.java file. Figure 7 depicts the code around line 21 of the ResourceMonitor.java file. This code reveals that the ResourceDataTwo thread executes a lockFirstResource()method, which in turn invokes a synchronized block; within this block, the thread is put to sleep for 500 milliseconds. Once the sleep ends, the block will invoke the lockSecondResource() method; both this method and the lockFirstResource() method are also executed by the ResourceDataOne thread.
From the discussion above, the following are evident:
- The ResourceDataOne thread will not be able to execute the lockSecondResource() method, since the ResourceDataTwo thread calls this method within a synchronized block – this implies that the ResourceDataTwo thread will ‘block’ the ResourceDataOne thread from executing the lockSecondResource() method until such time that ResourceDataTwo executes the method.
- The ResourceDataTwo thread on the other hand, will not be able to execute the lockFirstResource() method, since the ResourceDataOne thread calls this method within a synchronized block – this implies that the ResourceDataOne thread will ‘block’ the ResourceDataTwo thread from executing the lockFirstResource() method until such time that ResourceDataOne executes the method.
Since both threads keep blocking each other, a deadlock situation occurs.
With that, we have demonstrated the eG JVM Monitor’s ability to detect deadlock threads and lead you to the precise line of code that could have caused the deadlock.