Identifying and Diagnosing a Thread Blocking Issue in the JVM
This section once again takes the example of the aws02_japp:7077 application used by Identifying and Diagnosing a CPU Issue in the JVM. Here, we will see how the eG JVM Monitor instantly identifies blocked threads, and intelligently diagnoses the reason for the blockage.
If one/more threads executing within the aws02_japp application get blocked, the Blocked threads measure reported by theJVM Threads test mapped to the JVM Internals layer captures and reports the count of blocked threads. When this happens, eG Enterprise automatically raises this as a problem condition and changes the state of the Blocked threads measure (see Figure 1).
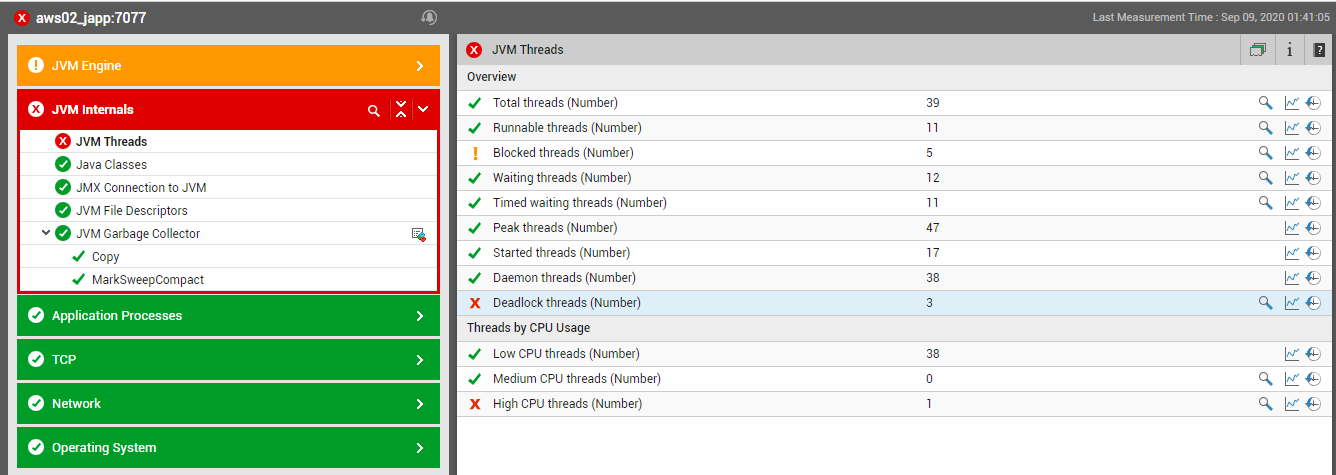
Figure 1 : The value of the Blocked threads measure being incremented by 1
According to Figure 1, the eG JVM Monitor has detected that five (5) threads running in the aws02_japp application have been blocked. To know which threads they are and for how long they have been blocked, click on the 'magnifying glass' icon corresponding to the Blocked threads measure. Figure 2 will then appear revealing the name of the blocked threads, how long they were blocked, the CPU usage of the threads, and the time for which the threads were in waiting.
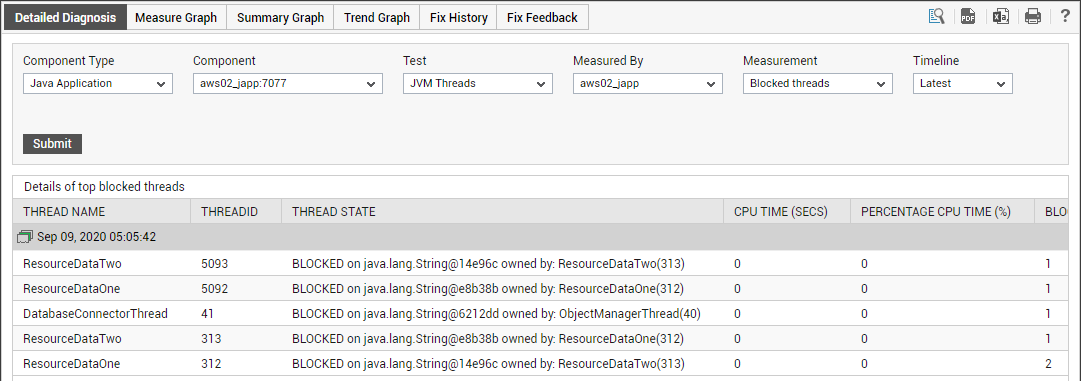
Figure 2 : The detailed diagnosis of the Blocked threads measure revealing the details of the blocked threads
To know the percentage of time for which these threads were blocked, scroll to the right of the Detailed Diagnosis page of Figure 2. As can be inferred from Figure 3, all the five threads have been blocked 100% of time.
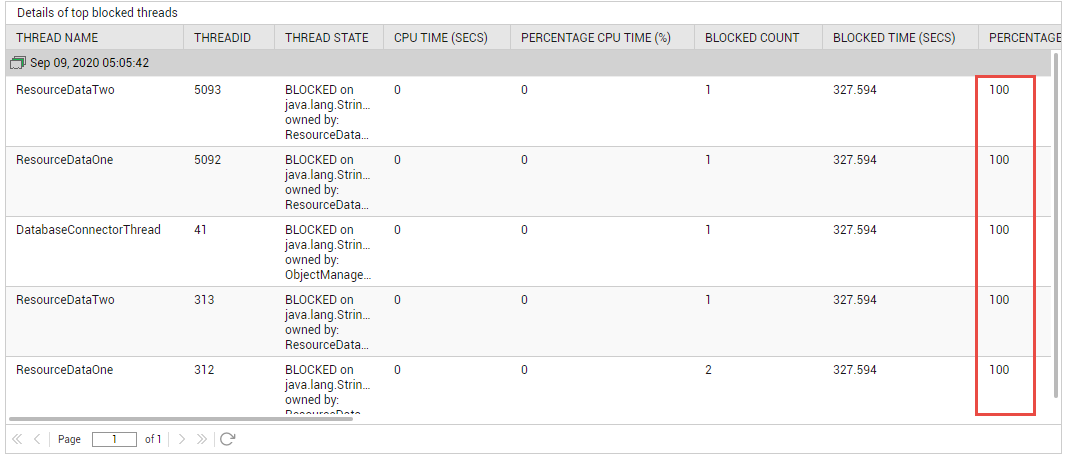
Figure 3 : The percentage of time for which each thread was blocked
Let us zoom into a single thread - say, the DatabaseConnectorThread in Figure 2 - and figure out who or what is blocking that thread, and why. To achieve this, we need to analyze the stack trace information of the blocked thread. To access the stack trace of the DatabaseConnectorThread, click on the  icon in Figure 2. Figure 4 then appears.
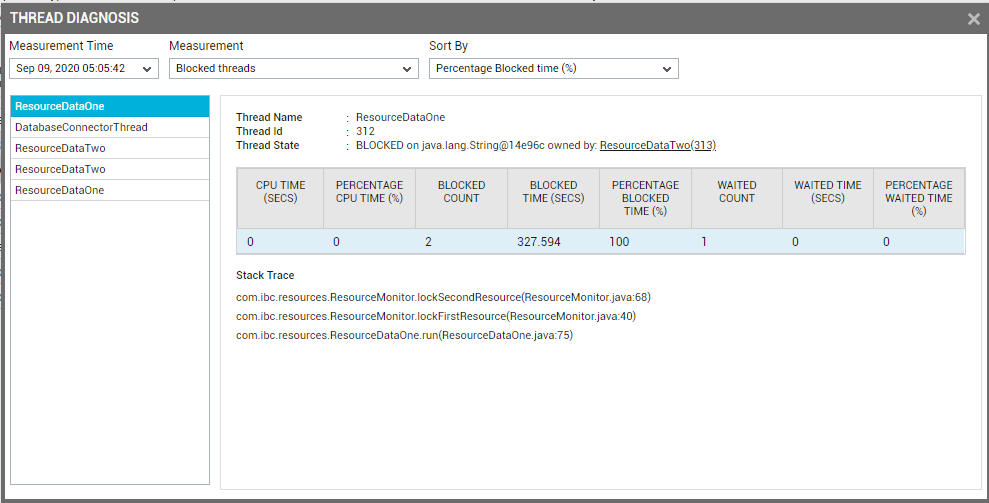
Figure 4 : The THREAD DIAGNOSIS window for blocked threads
The left panel of Figure 4 reveals all the five blocked threads. To focus on the DatabaseConnectorThread, click on it. The right panel will then change as depicted by Figure 5.
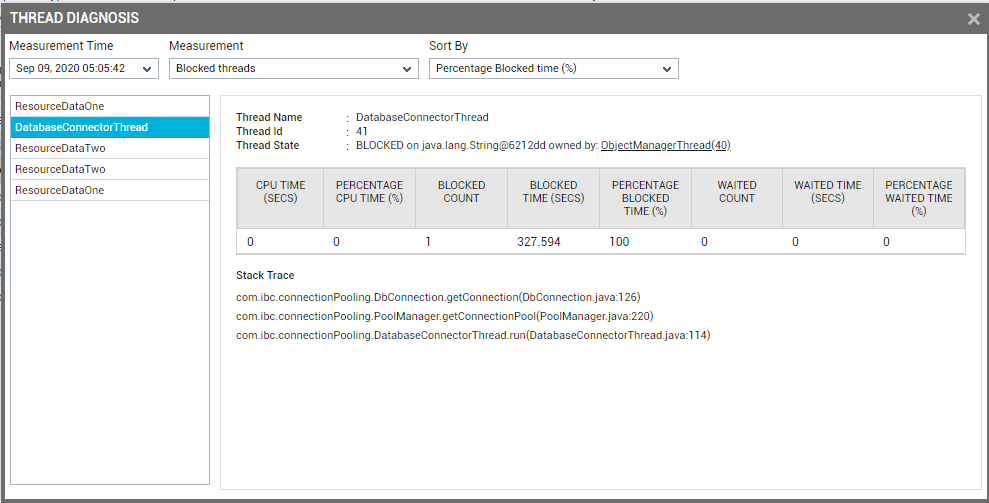
Figure 5 : Stack trace of the DatabaseConnectorThread
Besides the name and ID of the DatabaseConnectorThread, the right panel provides the following information about that thread:
- The Thread State indicating the thread that is blocking the DatabaseConnectorThread, and the object on which the block occurred; from the right panel of Figure 4, we can infer that the DatabaseConnectorThread has been blocked on the java.lang.String@6212dd object owned by the ObjectManagerThread.
- The CPU usage of the DatabaseConnectorThread, and the number of times and duration for which this thread has been blocked and has been in waiting;
- The Stack Trace of the DatabaseConnectorThread.
Let us proceed to determine the root-cause for this block. For this purpose, the Stack Trace of the DatabaseConnectorThread needs to be analyzed. As stated earlier, the stack trace needs to be analyzed in the top-down manner to identify the method that could have caused the block. Accordingly, we can conclude that the first method in the Stack Trace in Figure 4 is most likely to have introduced the block. This method, as can be seen from Figure 5, executes the lines of code starting from line 126 contained within the Java program file named DbConnection.java. In all probability, the problem should exist in this code block only. Reviewing this code block can therefore shed more light on the reasons for the DatabaseConnectorThread getting blocked. Hence, let us first open the DbConnection.java file in an editor (see Figure 6).
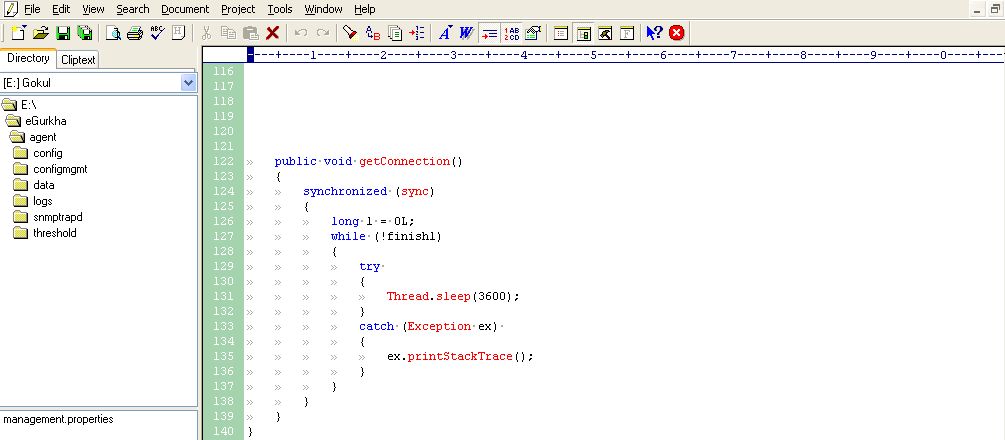
Figure 6 : The DbConnection.java program file
Line 126 of Figure 6 is within a synchronized block. The object used to synchronize the accesses to this block is a variable named “sync”. Looking at the variable declarations at the top of the source code, we can see that the “sync” variable refers to the static string “test” (see Figure 37).
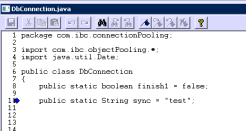
Figure 7 : The lines of code preceding line 126 of the DbConnection.java program file
By comparing information form stack trace and the source we can see that the DatabaseConnectorThread is stuck entering the synchronized block. Access to the synchronized block is exclusive – so some other thread is blocking this DatabaseConnectorThread from entering the synchronized block. Looking at the stack trace again (see Figure 5), we can see the name of the blocking thread. The blocking thread is the thread named “ObjectManagerThread”.
We can now use the stack trace tool again to see the stack trace of the blocking ObjectManagerThread.
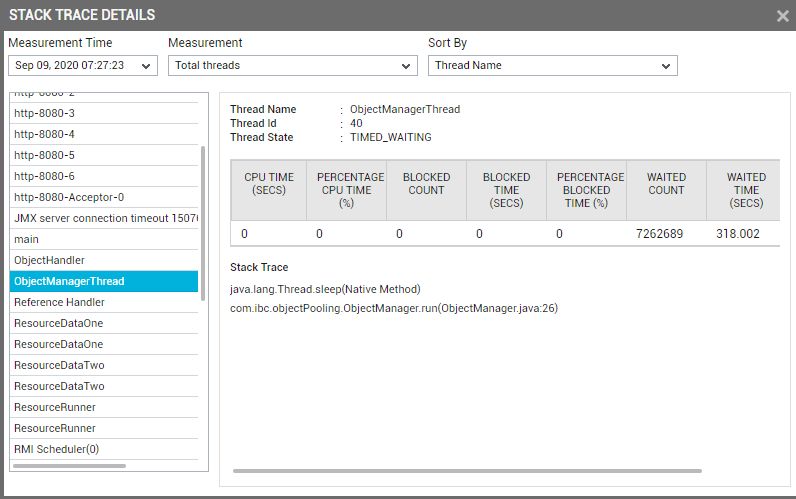
Figure 8 : Viewing the stack trace of the ObjectManagerThread
From here, we can see that the ObjectManagerThread went into a timed waiting state at line number 26 of the ObjectManager.java source code.
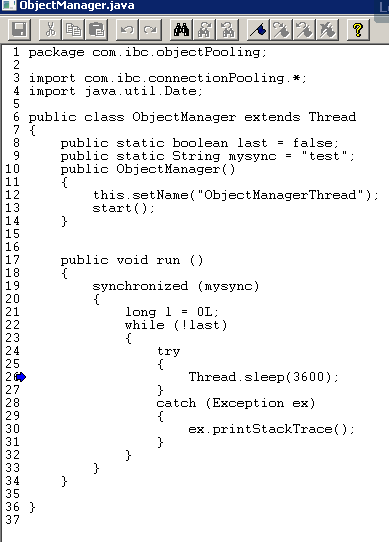
Figure 9 : The lines of code in the ObjectManager.java source file
Again, using a text editor, we can see that the ObjectManager thread enters a 3600 second timed wait at line 26. This sleep call is inside a synchronized block with the local variable “mysync” being used as the object to synchronize on.
The key to troubleshooting this problem is to look at the variable declarations at the top of each source code file.
On the surface, it is not clear why the ObjectManager thread, which synchronizes a block using a variable called “mysync” which is local to this class would be blocked by the DbConnection thread, which synchronizes on a variable called “sync” that is local to the DbConnection class.
An astute java programmer, however, would know to look at the variable declarations at the top of each source code file. In that way, one will quickly observe that both the "mysync" variable of the ObjectManager class and the "sync" variable of the DbConnection class in fact refer to the same static string: “test”.
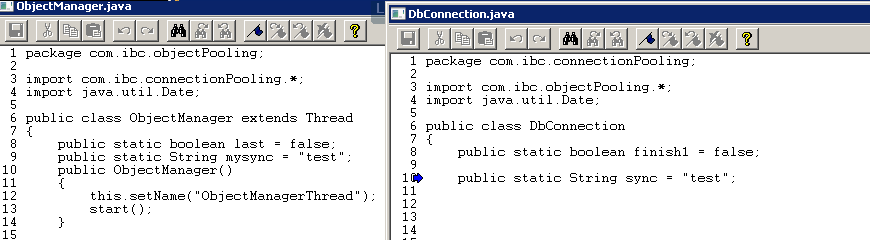
Figure 10 : Comparing the ObjectManager and DbConnection classes
So, even though the programmer has given two different variable names in the two classes, the two classes refer to and are synchronizing on the same static string object “test”. This is why two unrelated threads are interfering with each other’s execution.
Modifying the two classes – ObjectManager and DbConnection – so that the variables "mysync" and "sync" point to two different strings by using the new object creator resolves the problem in this case.
We have demonstrated here a real-world example, where because of the careless use of variables, one could end up in a scenario where one thread blocks another. The solution in this case to avoid this problem is to define non-static variables that the two classes can use for synchronization. This example has demonstrated how the eG Java Monitor can help diagnose and resolve a complex multi-thread synchronization problem in a Java application.