


When applications suffer performance degradation often the root cause of the issue is a database problem. In this guide we’ll show you 7 ways of troubleshooting Azure SQL database performance issues using metrics and insights from the eG Enterprise monitoring solution.
We recently published an article on the three Azure SQL deployment options and how to choose between:
- Azure SQL Database
- Azure SQL Managed Instance
- SQL Server on Azure Virtual Machines (VMs)
Regardless of which option you chose, eG Enterprise can proactively monitor and alert the database administrator to issues that could eventually impact performance and availability of the database and eventually impact end users and the applications that they rely on.
Troubleshooting Azure SQL Database Performance
This guide will focus on 7 key ways in which you can ensure SQL database health when using Azure SQL Database, including the key metrics, errors and logs to track and watch, troubleshooting tips, and how dashboards and reporting can be leveraged to communicate and track KPIs and SLAs.
Although focused on Azure SQL Database, the interfaces and the advice in this article also applies to monitoring Azure SQL Managed Instance.
7 Key Ways to Troubleshoot, Monitor and Optimize your Azure SQL Deployments
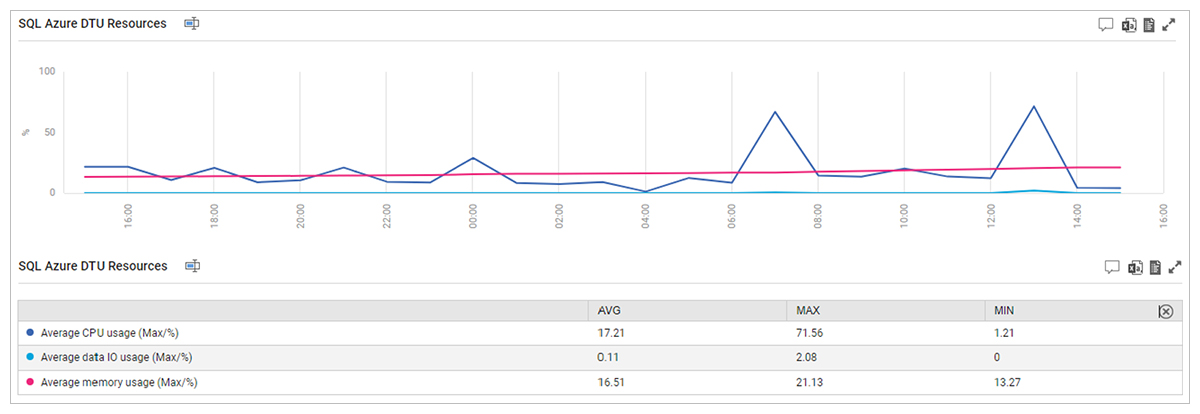
1) Monitoring Azure SQL DTU Usage Against the Provisioned Limit and its Impact
A Database Transaction Unit (DTU) represents a blended measure of CPU, memory, reads, and writes on your database or elastic pool as a percentage. DTUs can be used within certain pricing models, a full definition and explanation of DTUs can be found in: DTU-based purchasing model – Azure SQL Database | Microsoft Docs.
DTU usage can be an indicator that access patterns have changed in the application, slow queries or that the database is near its capacity limits. Running at consistently high DTU usage, especially near 100% usage will be detrimental to the performance of your database and should be investigated as soon as possible.
The resulting impact could be longer query times and rejected transactions due to timeouts.
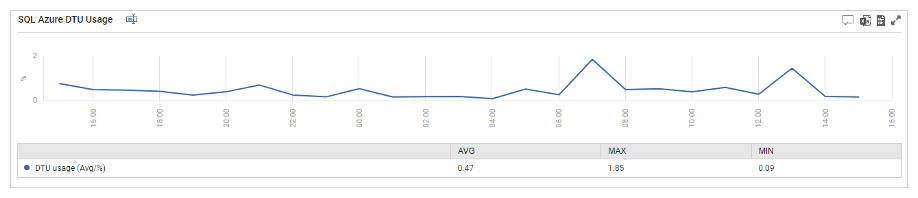
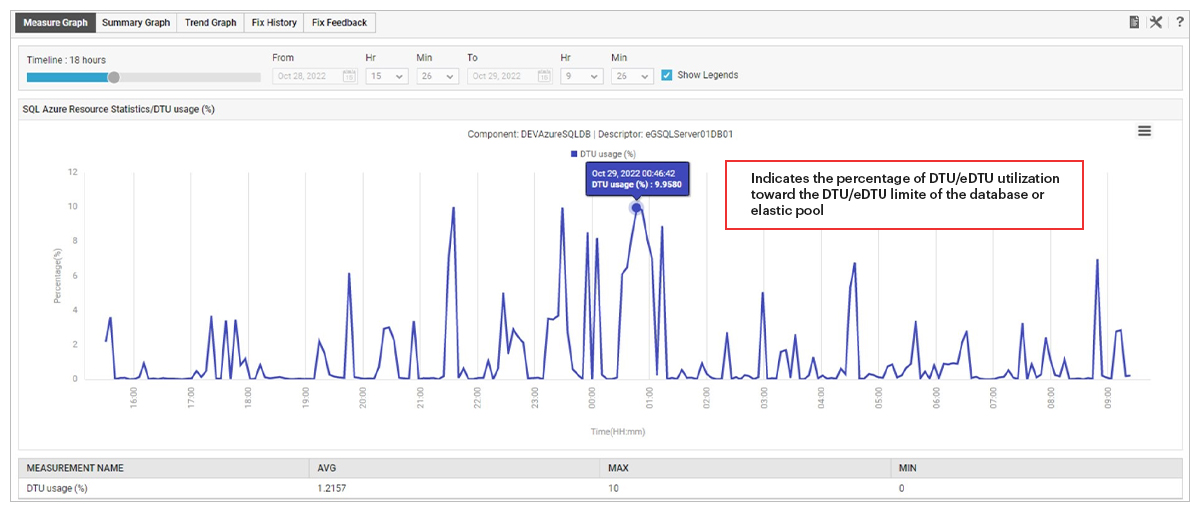
To aid with troubleshooting, eG Enterprise monitors the DTU usage percentage levels as well as resource usage related to CPU, Memory, and IO.
The eG Enterprise monitoring platform identifies the top queries by I/O activities, CPU usage, memory usage and queries that are executing for excessive times. eG Enterprise also highlights details of the username, application, and query responsible for poor performance.
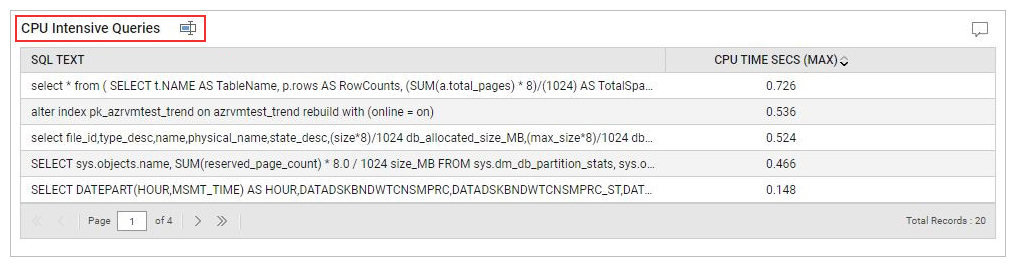
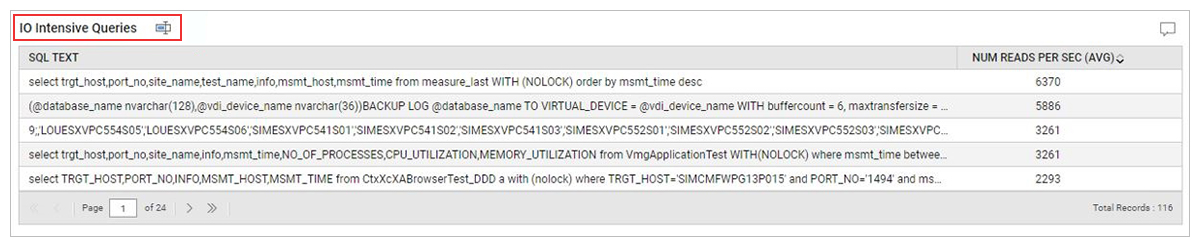
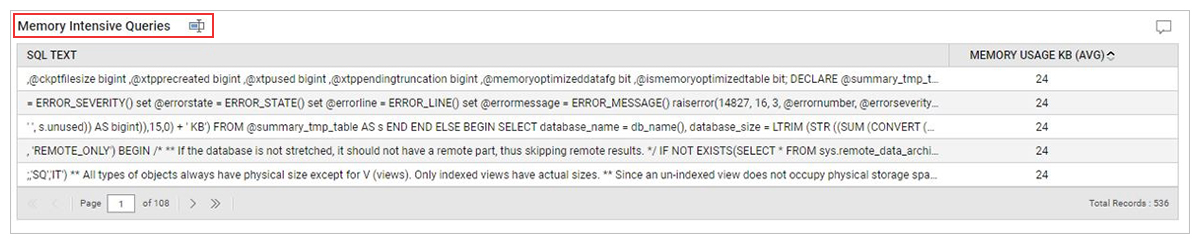
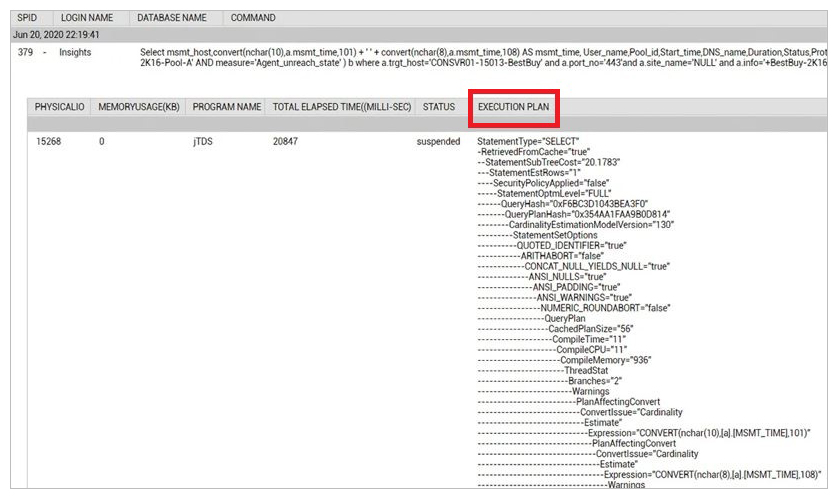
The platform also provides drill downs for the execution plan details of the poorly performing queries and thereby helps to optimize queries and help with troubleshooting your Azure SQL database for better performance.
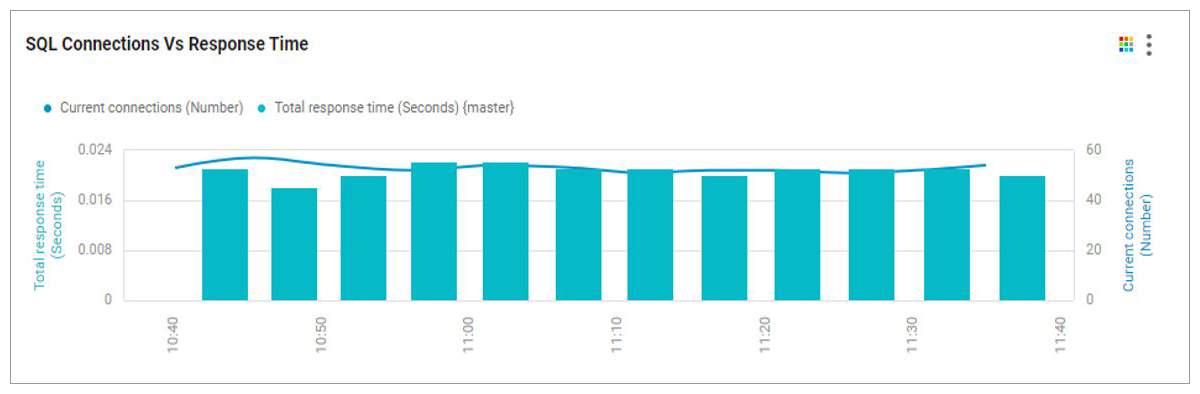
2) Monitor for Slowness or Slowdowns of the Database Impacting User Sessions and Identify Connection Leaks in the Database
To ensure database and application availability for end-users you need to monitor the session activity to identify connection leaks and get proactive notifications if there are a growing number of connections due to resource contention in the database.
The AIOps (Artificial Intelligence for IT Operations) engine within the eG Enterprise platform will learn about normal connection patterns and apply dynamic thresholds that automatically alert the administrator to anomalous and abnormal behavior, allowing you to troubleshoot before end-users are impacted.
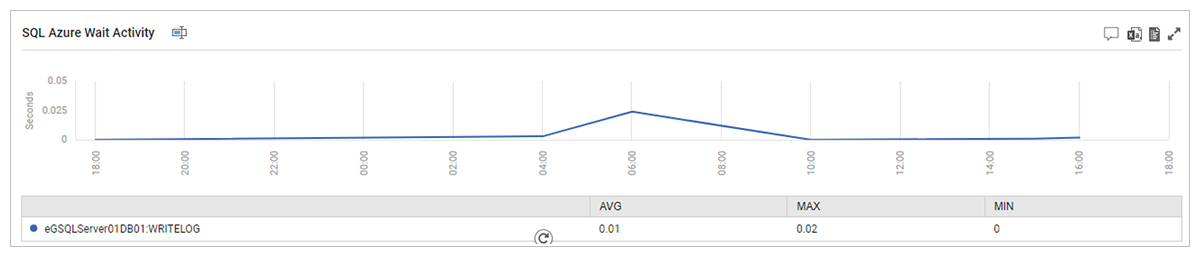
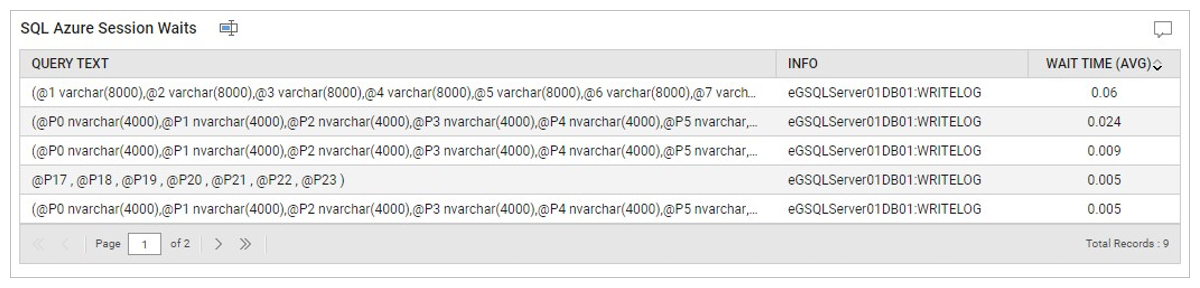
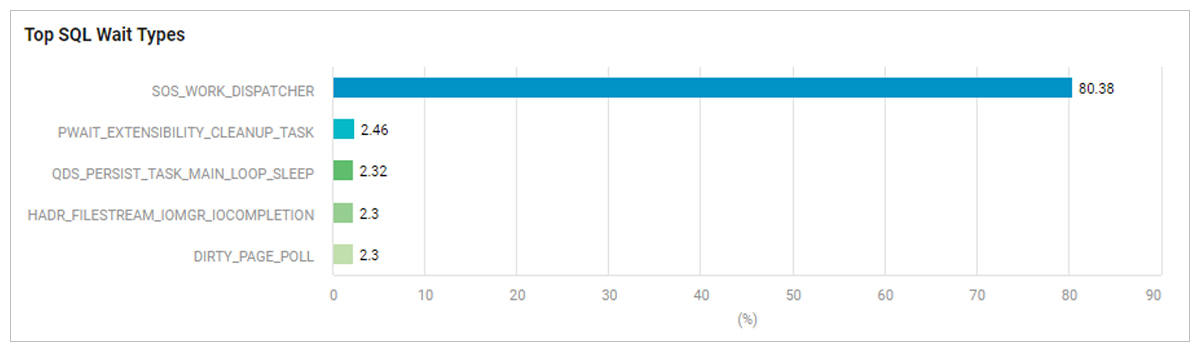
3) Monitor Session Waits and Identify the Queries that are Waiting for Excessive times for a Specific wait Resource
SQL Server Wait time can be described as the elapsed time until the worker thread suspended status returns to the running status. The wait times are captured and recorded by the SQL Server and bundled into a metric called wait statistics. This provides assistance to resolve problems that are related to the SQL Server performance and helps identify and optimize the queries which consume high resources of the system.
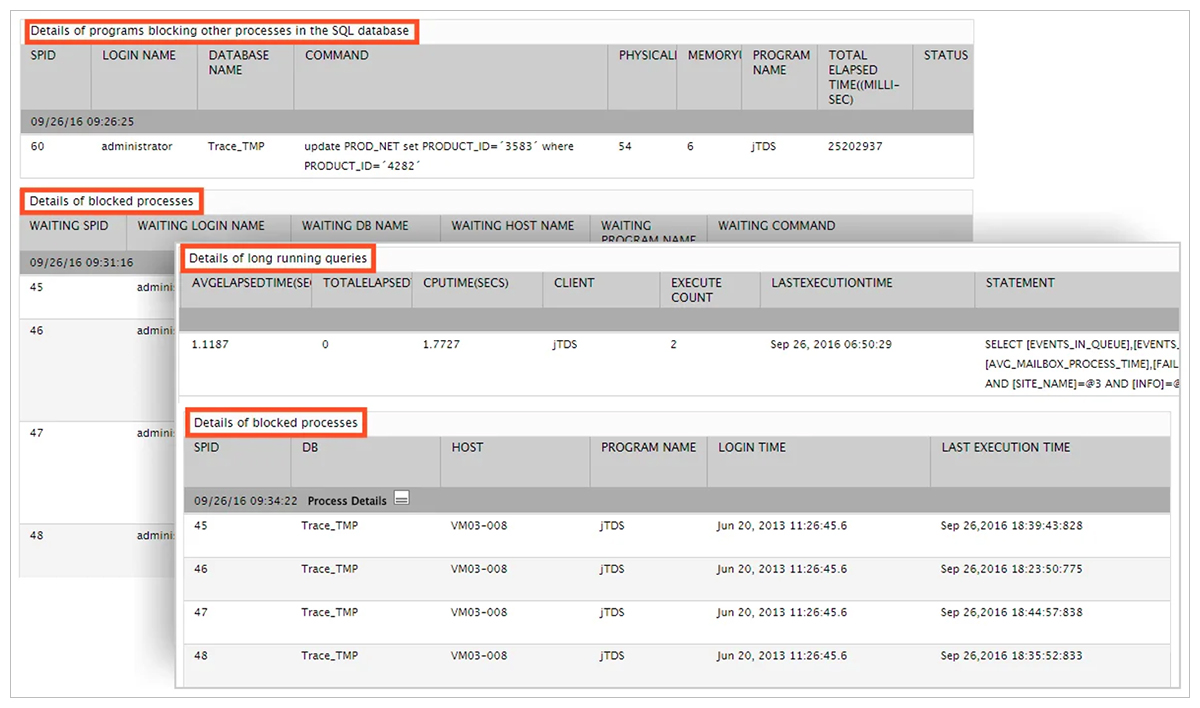
4) Track all Connections to the Database Server by State and Identify Connections that are Waiting for other Connections
eG Enterprise will report on root-blockers – i.e., queries that are blocking other queries and provide historical insights which are a key part of Azure SQL performance troubleshooting. Administrators can trace back in time and determine if inefficient queries are causing unnecessary locks. Detailed information is provided to identify root-blockers by SPID, programs running them, and queries issued.
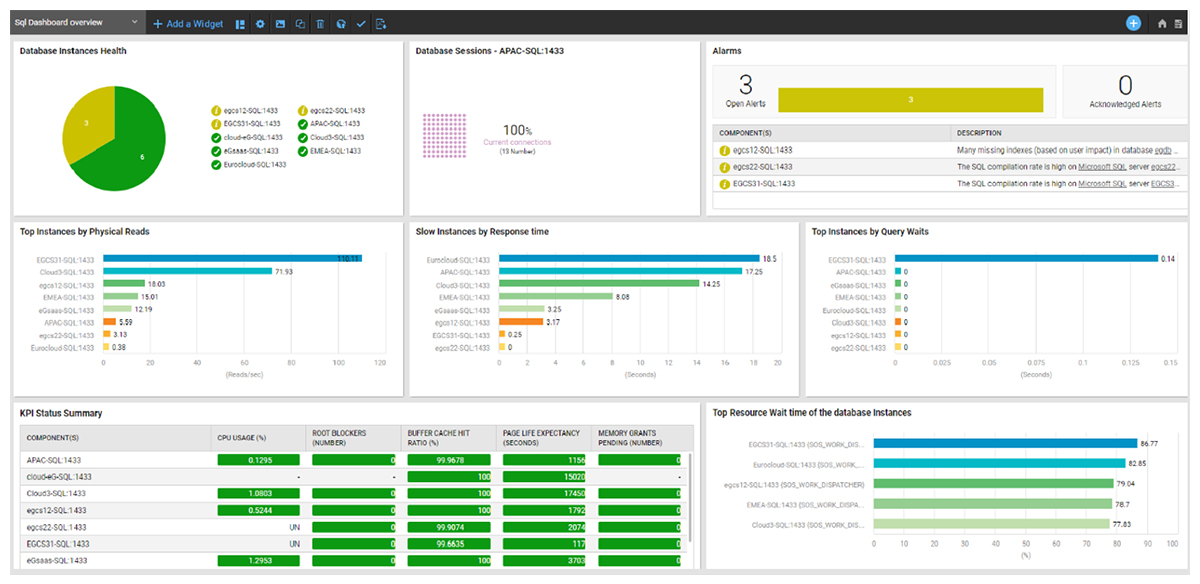
5) Leverage Dashboards
Out-of-the-box customizable dashboards are available for all major Azure databases including Azure SQL options. Providing actionable insights and detailed analytics to help with troubleshooting Azure SQL performance issues. In addition, role-based personalized dashboards can be made available to different stakeholders.
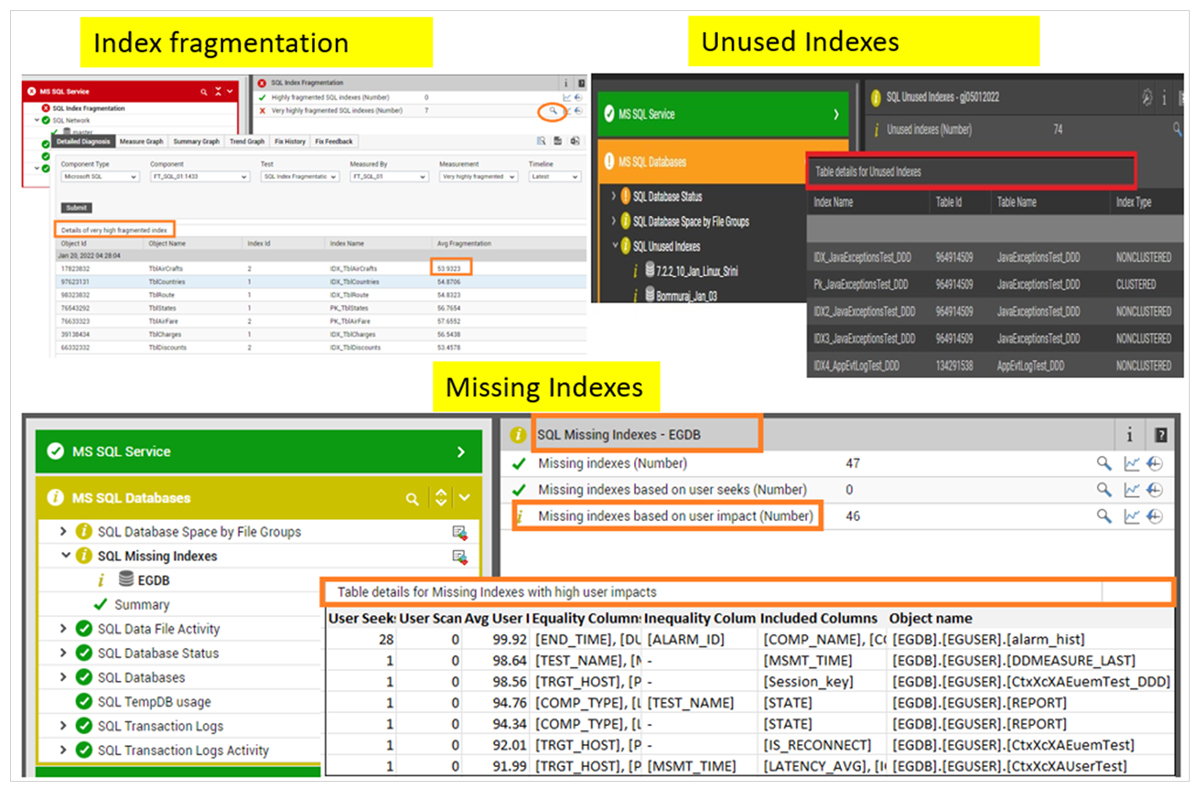
6) Monitor Database Indexing
Monitoring indexes is critical for Azure SQL database troubleshooting because the performance of the database impacts the applications depending on them. Over time, index fragmentation will cause a degradation in database performance and eventually poor application performance. eG Enterprise will automatically raise alerts if indexing issues start to occur allowing the database administrator to rectify issues long before end users experience issues with application performance. The platform provides detailed information on fragmented indexes and tables,
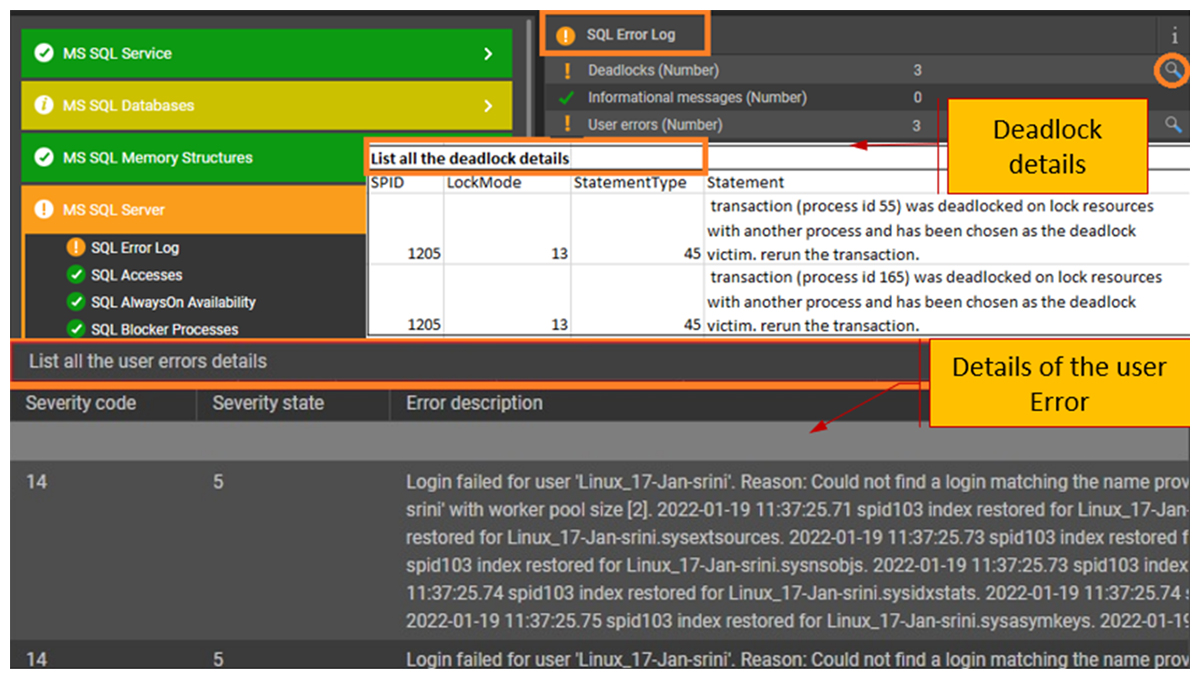
7) Continually Monitor SQL Log Files
eG Enterprise will continually monitor the SQL logs and provides detailed log analytics of SQL Server ensuring detailed information on critical errors such as deadlocks, query causing deadlock and details of the victim sessions, is always available. When performance problems happen, these metrics are critical when it comes to troubleshooting the root-cause of the slow down. Proactive alerts are configured out-of-the-box and can be tuned and customized by the administrator as required.
eG Enterprise is an Observability solution for Modern IT. Monitor digital workspaces,
web applications, SaaS services, cloud and containers from a single pane of glass.
Further Information:
- For more information on eG Innovations wider portfolio of monitoring support for Azure services, please see: Azure Cloud Monitoring Tools & Solutions | eG Innovations
- For information on eG Enterprise’s support for on-premises Microsoft SQL Server deployments, see: Microsoft SQL Server Performance Monitoring | eG Innovations
- Tips to select the best Azure SQL deployment option – Microsoft SQL Server Blog
- Compare the database engine features of SQL Database and SQL Managed Instance – Azure SQL Database & SQL Managed Instance | Microsoft Docs
- Recent announcements (Nov 2022) around feature parity between SQL Server and Azure SQL services from Microsoft point to a serious commitment to hybrid solutions and the benefits of using a solution such as eG Enterprise equally able to support migration between the two seamlessly, see: Microsoft releases SQL Server 2022 flagship database, unites on-premises and cloud services | VentureBeat


