Microsoft SQL server monitoring

Slow database performance is at the heart of most application issues. Identify whether it is slow queries, improper configuration, or the need for index tuning.

Free Trial

Trusted by leading companies

Proactive monitoring
of Microsoft SQL server

According to a recent Explore Group survey, Microsoft SQL server is one of the top database servers in use today. Services in most industries - healthcare, manufacturing, finance and more - rely on SQL database servers for data storage and access. Any performance degradation or unavailability of these servers can severely impact the performance of the entire service, often causing customer dissatisfaction and lost revenue. To prevent such situations, database administrators are tasked with making sure that their database servers are tuned well and responding as fast as possible to application requests. Performance monitoring can help database administrators:

  • Proactively detecting problems before they become user complaints;
  • Accurately diagnosing the cause of slowdowns: is it due to poor queries, missing indexes, insufficient memory, or storage latency?
  • Identify areas where the database subsystem can be optimized to deliver better performance to the application
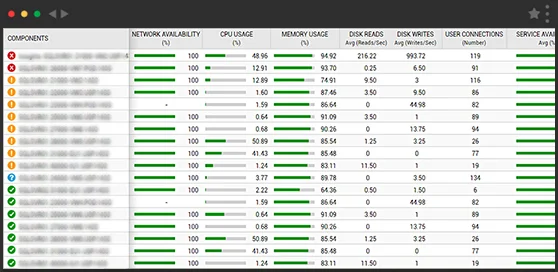
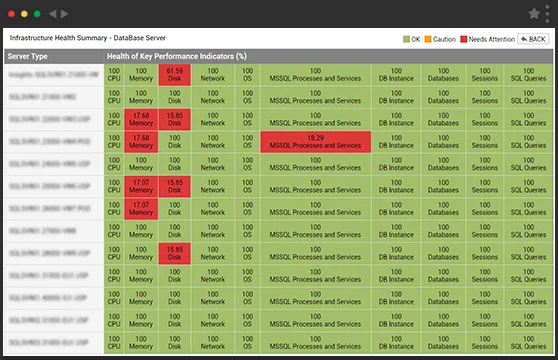
Dashboards provide quick status views of Microsoft sql server performance.

Troubleshoot slow database
queries with detailed analytics

  • Monitor transactions to all the databases on a server
  • Identify top queries by I/O activities, CPU usage, memory usage
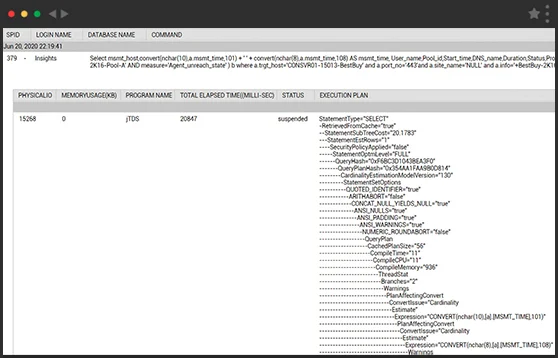
  • See execution plan for slow queries
  • Identify which queries are executing for a long time; highlight user name, application and query
  • Track missing and unused indexes and identify ways to optimize the database for best performance
  • Monitor fragmentation level of database tables and indexes, and be proactively alerted to situations when online/offline tuning of the database is required
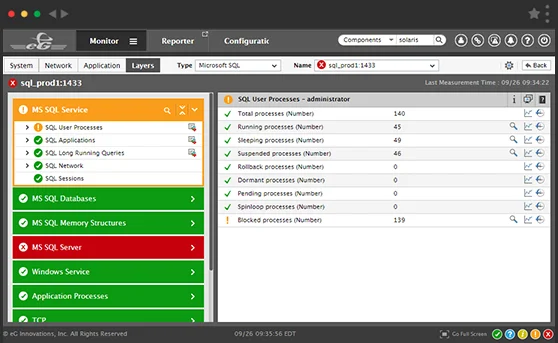
eG Enterprise provides robust testing  and visibility tools to quickly identify slow database queries

Get comprehensive insights into
database space usage and file activity

  • Monitor space usage by file groups; determine when the free space in a file group drops below acceptable limits
  • Track usage of the tempDB; determine if it is running out of space
  • Monitor the transaction logs of each of the databases. Report on databases that are using excessive transaction log space. Alert when a transaction log is reaching the maximum configured size limit.
  • Be notified when reserved space, data space and index space utilization of any database is nearing capacity
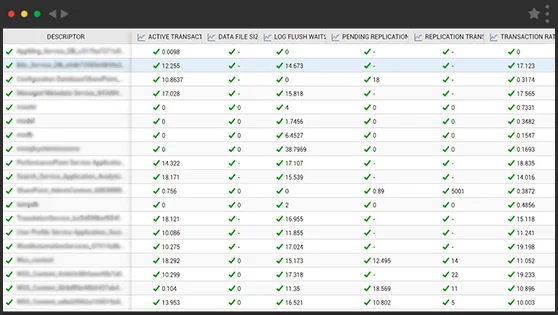
eG Innovations provides ways to easily track activity of each data field.
  • Track activity of each of the data files. Monitor I/O stalls on the data files. Identify if the I/O activity is not balanced across all data files and if additional data files are required to balance the I/O activity

Supported SQL server configurations:

  • eG Enterprise supports Microsoft SQL 2005, 2008, 2012, 2014, 2017 and 2019 versions; development and express editions. Support is available on Microsoft Windows and Linux platforms.
  • Support is also available for both named and port-based Microsoft SQL server installation.
  • Active/active and active/passive Microsoft SQL clusters are also supported
  • Choose between agent-based and agentless monitoring
 

eG Enterprise has been incredibly useful and has far exceeded our expectations. Metrics relating to SQL and missing indexes have provided critical information that we had long suspected were performance issues. Now
we have the information to address specific performance challenges.

Pejman Farahi Applications Specialist, Aird Berlis

Audit accesses to the SQL database server

  • Track the workload to the database server. Monitor transaction rates to each of the databases
  • Report on all active application/user connections to the database server and queries being processed
  • Identify which application/user is imposing the most load on the database server. Track if there is a database connection leak that is leaving orphaned connections to the database server
  • Report on top queries to the database server by application/client, categorized by CPU, memory and I/O time used
The Microsoft SQL Server Load Analyzer identifies which app or user imposes the most load on the server.

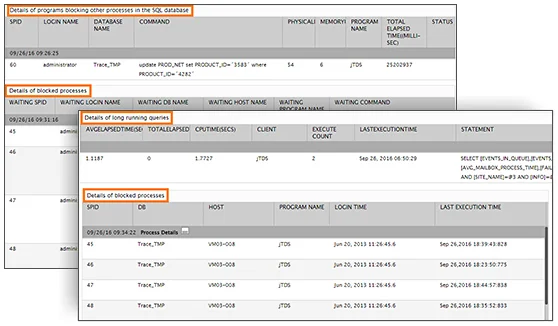
Identify lock and wait events that can slow query performance

  • Track all connections to the database server by state and identify connections that are waiting for other connections
  • Report on root-blockers - i.e., queries that are blocking other queries. Provide historical insights, so administrators can trace back in time and determine if inefficient queries are causing unnecessary locks. Identify root-blockers by SPID, programs running them and queries issued
  • Get alerted to deadlocks during query processing and identify the queries responsible for this
  • Monitor all types of waits happening on the database server. Differentiate between waits due to insufficient memory and due to slow I/O activities
  • Monitor data cache hit ratio and procedure cache ratio and be notified of specific objects that are consuming too much memory in the cache

Monitor database
server health

Track the key parameters that can affect database server performance:

  • Does the server have sufficient CPU, memory and disk resources?
  • Is one of the disk drives seeing more I/O than others?
  • Is there excessive disk queueing that can affect response times?
  • Is the disk heavily fragmented and is defragmentation required?
  • Are there any I/O errors during disk access that may indicate a faulty disk that is affecting database access?
Microsoft IIS monitoring system status view
  • Get complete details of the wait events to figure out which process initiated the event

What Microsoft SQL monitoring
with
eG Enterprise reveals

With its ability to automatically determine baselines for every metric collected in the IT infrastructure, the eG Microsoft SQL monitor provides proactive alerts to administrators. In-depth snapshots of the Microsoft SQL server's usage are also provided periodically to assist with real-time and post-mortem diagnosis. Hourly, daily, and monthly trends are automatically computed, so administrators can effectively plan the utilization and capacity of their Microsoft SQL infrastructure.

SQL Server Performance Monitoring
  • Is the Microsoft SQL database server available for servicing requests?
  • What is the response time for a typical query?
  • How many logins/logouts are happening on the Microsoft SQL server?
  • Which applications/users are accessing the Microsoft SQL server and what is their respective resource usage?
  • What queries are each of the applications currently executing?
SQL Server Engine Monitoring
  • What is the CPU utilization of the SQL database server engine?
  • How much time is the SQL server spending on processing vs. I/O?
  • What is the typical workload on the database server?
  • Which databases are imposing most load on the database server engine?
  • How many processes are running, and what queries are they executing?
  • Which user(s) are executing these queries?
Lock Activity Monitoring
  • What is the typical locking activity on the database?
  • Which processes are being blocked and by whom?
  • Which are the root-blocker processes, and what queries are they executing?
  • Are any deadlocks happening?
Database Activity and Space Monitoring
  • What databases are hosted on the SQL server?
  • Is any of the databases reaching capacity?
  • Which of the databases is seeing more transaction activity?
  • How many active transactions are currently happening to each of the database server?
SQL Memory Monitoring
  • Is there sufficient memory available for the SQL server?
  • How much memory is the server consuming and how much is it willing to consume?
  • How much memory is used for connections, how much for locks, and how much for query optimizations?
  • What is the server's cache hit ratio?
  • How many pages are available in the server's buffer pool?
  • How many of these are free pages?
  • Is Page life expectancy very low or are there many memory grants pending, indicating a memory shortage?
Operating System Monitoring
  • Is there sufficient disk capacity?
  • Is there excessive contention for CPU or memory resources?
  • Are the disks unusually busy? If so, which files are being read or being written to?
  • Is the fragmentation level of the disks very high?
  • Which processes are taking up most resources (CPU, memory, disk, etc.)?

Monitor SQL server performance from an application perspective

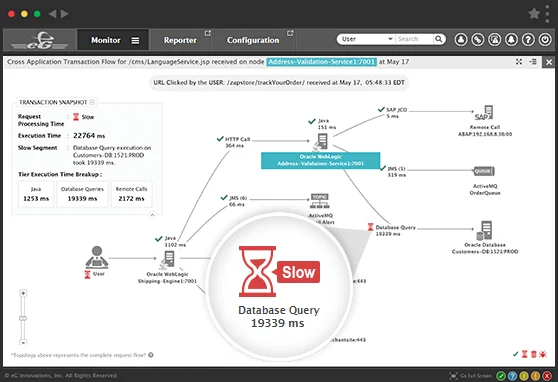
eG Enterprise application performance monitoring allows database performance to be monitored in the context of the applications using the database server.

  • Without requiring any agents on the database servers, eG Enterprise APM traces all application accesses and reports on slow queries and exceptions during database processing.
  • When a specific web page or URL is slow, you don't have to wonder any more as to what is causing the slowdown. eG Enterprise APM gives you the answers at your fingertips.

This eliminates finger-pointing between application development, application operations and database admin teams.

Monitor SQL server performance from an application perspective

How eG Enterprise monitoring for SQL server helps

  • Generates proactive alerts based on a variety of SQL database server statistics that are collected and analyzed in real-time
  • Beyond the capabilities of siloed SQL server monitoring tools, eG Enterprise automatically correlates end-to-end service performance with database, server, and network performance, so you can quickly determine where the hot-spots in the infrastructure are
  • Provides trending and service level reports so you can assess the current capacity of your infrastructure and plan for future expansion
  • Eliminates finger-pointing among IT administrators by ensuring that problems are easily and rapidly isolated to specific application tiers, so only specific administrators need to be involved in fire-fighting

Start your free trial or schedule a custom demo with an engineer

  • Works on cloud environments, hybrid cloud setups and on-premises deployments
  • Deploy eG Enterprise using our SaaS platform or on-premises
  • Suitable for monitoring applications, digital workspaces and IT infrastructures
Please Enter Valid Work Email
eG Enterprise