Monitoring Apache Impala
eG Enterprise offers a special-purpose monitoring model for the Apache Impala to monitor the status and overall performance of the target Apache Impala.
Figure 1 depicts the layer model of an Apache Impala.
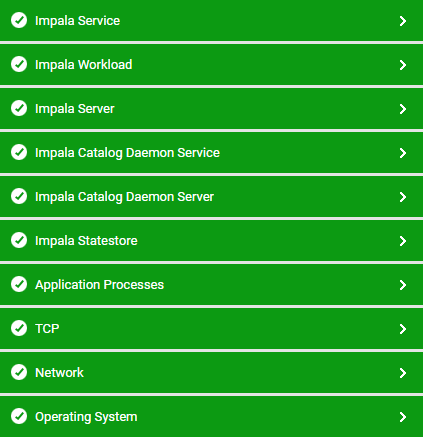
Figure 1 : Layer model for Apache Impala
Every layer in the Figure 1 is mapped to various tests to determine the critical statistics related to the performance of the target Apache Impala. Using the metrics reported by the tests, administrators can find accurate answers for the following performance queries:
-
Were many queries in Impala Daemon server shows waiting status?
-
Were many timed out senders noticed on the Impala Daemon server?
-
Is TCMalloc utilizing excessive memory on the Impala Daemon server? How about the buffer pool?
-
Were many Remote Procedure Calls made to the Backend, Beewax, Hiveserver2 and Statestore Subscriber servers?
-
Were many closed/expiry sessions observed on the Imapala Daemon server?
-
Were many inactive Statestore subscriber clients noticed on the Impala Daemon server?
-
Were many requests rejected and timed-out in the resource pool of the target Impala Daemon server?
-
Were many inactive Backend clients noticed on the Impala Daemon server?
-
Were many unused IO buffers noticed on the Impala Daemon server?
-
Is the Impala Daemon server hogging CPU resources?
-
Is the Impala Daemon connected to the Statestore server?
-
Are thread groups in Impala Daemon server consuming CPU resources abnormally?
-
Is the Impala Daemon server over-utilizing JVM memory?
-
Is the Impala Daemon server ready for monitoring?
-
Is any application hogging the system memory reserved by TCMalloc on the Impala Daemon server?
-
Are many Backend, Beeswax frontend and Hiveserver2 frontend connections to the Impala Daemon server inactive?
-
Were many inactive clients noticed on the Catalog Server?
-
Were many Remote Procedure Calls made to the Catalog server?
-
Is the Catalog Daemon connected to the Statestore server?
-
Is the Catalog Daemon server over-utilizing JVM memory?
-
Is the Catalog Daemon server hogging CPU resources?
-
Is TCMalloc utilizing excessive memory on the Catalog Daemon server? How about the buffer pool?
-
Were many inactive StateStore subscriber clients noticed on the Catalog Daemon server?
-
Is the Catalog Daemon server ready for monitoring?
-
Is any application hogging the system memory reserved by TCMalloc on the Catalog Daemon server?
-
Are thread groups in Catalog Daemon server consuming CPU resources abnormally?
-
Are many client connections to the Catalog server inactive?
-
Were many Remote Procedure Calls made to the Statestore server?
-
Were many inactive StateStore subscriber clients noticed on the Statestore server?
-
Is any application hogging the system memory reserved by TCMalloc on the Statestore Daemon server?
-
Is the Statestore Daemon server hogging CPU resources?
-
Are many connections to the Statestore Daemon server inactive?
Since the Operating System, Application Processes and TCP layers have been elaborately discussed in Monitoring Unix and Windows Servers document, and the tests mapped to the Network Layer have been elaborately discussed in Monitoring Cisco Router document, the sections to come will discuss the other layers in detail.