Fabric Interconnect FC Ports Test
The Cisco UCS fabric interconnect includes the following key Fibre Channel (FC) port types:
- Uplink FC Ports : Uplink Fibre Channel ports handle FCoE traffic between the fabric interconnect and the next layer of the network. All network-bound FCoE traffic is pinned to one of these ports. If one/more of these ports are not operable or a traffic congestion occurs on any of these ports, then, significant latencies can be noticed in the FCoE communication between the corresponding interconnect and the network. To avoid this, you need to constantly observe the operational status, overall health, and the traffic flowing to and from each of the FC ports on every fabric interconnect, spot abnormalities quickly, and fix them before it is too late. This test enables you to do just that.
- Storage FC Ports : The Storage FC Port type allows for the direct attachment of a FC storage device to one of the native FC ports on the Fabric Interconnect expansion modules. Like the FCoE Storage Port type, the FC frames arriving on these ports are expected to be un-tagged – so no connection to an MDS FC switch, etc. Each Storage FC Port is assigned a VSAN number to keep the traffic separated within the UCS Unified Fabric. When used in this way, the Fabric Interconnect is not providing any FC zoning configuration capabilities – all devices within a particular VSAN will be allowed, at least at the FC switching layer (FC2), to communicate with each other.
In addition, the fabric interconnect supports Monitoring FC Ports, and FC ports that have not yet been configured to perform any function and are hence still UnConfigured FC Ports.
The test runs frequent health checks on each of the FC ports in every fabric interconnect, and turns the spotlight on overloaded ports, non-operational ports, and ports that are operating at a slow pace.
Target of the test : A Cisco UCS manager
Agent deploying the test : A remote agent
Outputs of the test : One set of results for each FC port in every fabric interconnect managed by the Cisco UCS manager being monitored.
| Parameter | Description |
|---|---|
|
Test Period |
How often should the test be executed. |
|
Host |
The IP address of the host for which the test is being configured. |
|
Port |
The variable name of the port at which the specified host listens. |
|
UCS User and |
Provide the credentials of a user with at least read-only privileges to the target Cisco UCS manager. |
|
Confirm Password |
Confirm the password by retyping it here. |
|
SSL |
By default, the Cisco UCS manager is SSL-enabled. Accordingly, the SSL flag is set to Yes by default. |
|
Web Port |
By default, in most virtualized environments, Cisco UCS manager listens on port 80 (if not SSL-enabeld) or on port 443 (if SSL-enabled) only. This implies that while monitoring Cisco UCS manager, the eG agent, by default, connects to port 80 or 443, depending upon the SSL-enabled status of Cisco UCS manager - i.e., if Cisco UCS manager is not SSL-enabled (i.e., if the SSL flag above is set to No), then the eG agent connects to Cisco UCS manager using port 80 by default, and if Cisco UCS manager is SSL-enabled (i.e., if the SSL flag is set to Yes), then the agent-Cisco UCS manager communication occurs via port 443 by default. Accordingly, the WebPort parameter is set to default by default. In some environments however, the default ports 80 or 443 might not apply. In such a case, against the WebPort parameter, you can specify the exact port at which the Cisco UCS manager in your environment listens, so that the eG agent communicates with that port for collecting metrics from the Cisco UCS manager. |
|
Show Overall Status |
By default, regardless of the Administrative state of an FC Port, this test reports the Overall status of that port. In other words, by default, this test reports the Overall status measure for an FC port, even if the Administrative state of that port is Disabled. This is because, the show overall status flag is set to Yes by default. If this flag is set to No instead, then this test will report the Overall status of only those FC ports that are currently in an Enabled Administrative state. |
|
Detailed Diagnosis |
To make diagnosis more efficient and accurate, the eG Enterprise embeds an optional detailed diagnostic capability. With this capability, the eG agents can be configured to run detailed, more elaborate tests as and when specific problems are detected. To enable the detailed diagnosis capability of this test for a particular server, choose the On option. To disable the capability, click on the Off option. The option to selectively enable/disable the detailed diagnosis capability will be available only if the following conditions are fulfilled:
|
| Measurement | Description | Measurement Unit | Interpretation | ||||||||||||||||||||||||
|---|---|---|---|---|---|---|---|---|---|---|---|---|---|---|---|---|---|---|---|---|---|---|---|---|---|---|---|
|
Administrative state |
Indicates the current administrative status of this FC port in this fabric interconnect. |
|
This measure reports either Enabled or Disabled as the administrative status a port. The states and their corresponding numeric equivalents are shown in the table below:
Note: By default, this measure reports the above-mentioned States while indicating the administrative status of an FC port. However, in the graph of this measure, states will be represented using their numeric equivalents only - i.e., 1 or 2. |
||||||||||||||||||||||||
|
Overall status |
Indicates the overall status of this FC port in this fabric interconnect. |
|
The States reported by this measure and their corresponding numeric equivalents are described in the table below:
Note: By default, this measure reports the above-mentioned states while indicating the overall status of an FC port. However, in the graph of this measure, states will be represented using their corresponding numeric equivalents only. The detailed diagnosis of this measure provides the Time, ID, Slot ID, Port Type, Network Type, Transport Type, WWPN and Mode attributes for each FC port. |
||||||||||||||||||||||||
|
Negotiated speed |
Indicates the current operating speed of this FC port in this fabric interconnect. |
|
The values reported by this measure and their corresponding numeric equivalents are described in the table below:
Note: By default, this measure reports the above-mentioned Measure Values while indicating the operational speed of an FC port. However, in the graph of this measure, the speed will be represented using the corresponding numeric equivalents only. |
||||||||||||||||||||||||
|
Data received |
Indicates the amount of data received by this FC port during the last measurement period. |
MB |
Compare the value of these measures across all FC ports to determine which port is handling the maximum data traffic.
|
||||||||||||||||||||||||
|
Data transmitted |
Indicates the amount of data sent by this FC port during the last measurement period. |
MB |
|||||||||||||||||||||||||
|
Packets received |
Indicates the number of packets received by this FC port during the last measurement period. |
Number |
Compare the value of these measures across all FC ports to determine which port is handling the maximum packet traffic. |
||||||||||||||||||||||||
|
Packets transmitted |
Indicates the number of packets transmitted by this FC port during the last measurement period. |
Number |
|||||||||||||||||||||||||
|
Crc received |
Indicates the number of Cyclic Redundancy Check (CRC) errors that occurred during data trafficking in this FC port, during the last measurement period. |
Errors |
CRC or Cyclic Redundancy Check is a process that helps in identifying any errors that might occur during the data transmission process. Data is usually transmitted in small blocks, and a CRC value is assigned to each block and transmitted along with it. This CRC value is verified at the destination to ensure that it matches the CRC value transmitted from the source. A CRC error occurs when the two values (source and destination) do not match and the test fails. The main benefit of CRC is that it helps you ensure that data you have received or downloaded is not damaged or corrupt. By comparing the value of this measure across all FC ports, you can accurately identify most error-prone FC port. |
||||||||||||||||||||||||
|
Error received |
Indicates the total number of errors received by this FC port during the last measurement period. |
Errors |
|
||||||||||||||||||||||||
|
Error transmitted |
Indicates the total number of errors transmitted by this FC port during the last measurement period. |
Errors |
|
||||||||||||||||||||||||
|
Discard error received |
Indicates the total amount of data that was discarded during reception of data by this FC port since the last measurement period. |
MB |
|
||||||||||||||||||||||||
|
Discard error transmitted |
Indicates the total amount of data that was discarded during data transmission through this FC port since the last measurement period. |
MB |
|
||||||||||||||||||||||||
|
Too long error received |
Indicates the total number of errors that occurred when data of a large size was received by this FC port during the last measurement period. |
Errors |
Ideally, the value of this measure should be low. A high value is indicative of many errors during data reception. To identify the most error-prone port, compare the value of this measure across FC ports. |
||||||||||||||||||||||||
|
Too short error received |
Indicates the total number of errors that occurred due to truncated or corrupt data received by this FC port during the last measurement period. |
Errors |
Ideally, the value of this measure should be low. A high value is indicative of many errors during data transmission. To identify the most error-prone port, compare the value of this measure across FC ports. |
||||||||||||||||||||||||
|
Signal losses |
Indicates the signal losses that occurred on this FC port during data transmission and reception in the last measurement period. |
Errors |
Ideally, the value of this measure should be 0. |
||||||||||||||||||||||||
|
Synchronize losses |
Indicates the losses that occurred due to synchronization of this FC port with other components during the last measurement period. |
Errors |
Ideally, the value of this measure should be 0. |
||||||||||||||||||||||||
|
Link failures |
Indicates the link failures that occurred between this FC port blade server chassis during the last measurement period. |
Errors |
Ideally, the value of this measure should be 0. |
The detailed diagnosis of the Overall status measure provides the Time, ID, Slot ID, Port Type, Network Type, Transport Type, WWPN and Mode attributes for each FC port.
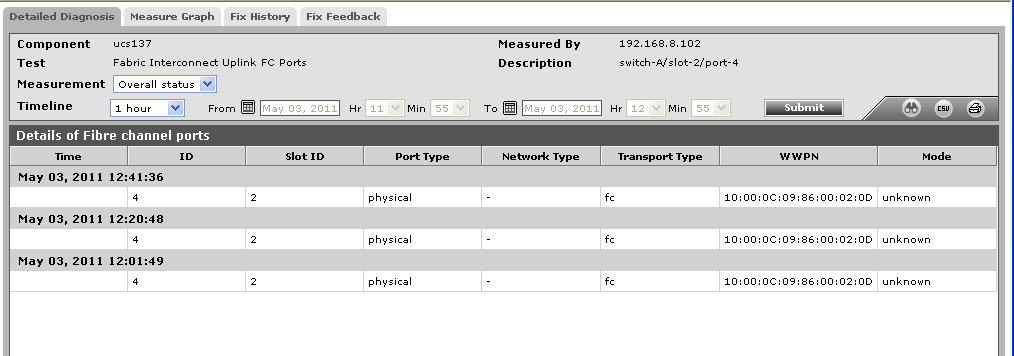
Figure 1 : The detailed diagnosis of the Fabric Interconnect Uplink FC Ports test