
Horizon UAG Sessions Test
By tracking the user activity on the gateway appliance, administrators will be able to determine the session load on the appliance at any given point in time. Also, when monitoring user sessions, administrators may be able to capture unexpected failures or abrupt session terminations and investigate the reason for the same. Such useful session-based insights are provided by the Horizon UAG Sessions test.
This test tracks user sessions to the gateway appliance and discovers the count of different type of sessions handled by the appliance, in terms of the protocol used - e.g., PCoIP sessions, RDP sessions, Blast sessions etc. The test also reports the sessions that were terminated and those sessions that failed. In addition, this test also reveals the unique users and unique clients who have initiated the sessions through the gateway appliance. The detailed diagnostics of this test reveals in-depth insights into the sessions initiated by the user. With the help of this test, administrators can quickly determine which type of sessions were frequently initiated by the users - is it the PCoIP sessions? or Blast session? or RDP session? or Desktop sessions? or Application sessions?
Target of the test : An Omnissa Horizon Unified Access Gateway
Agent deploying the test: A remote agent
Outputs of the test : One set of results for the target Omnissa Horizon Unified Access Gateway being monitored.
| Parameters | Description |
|---|---|
|
Test Period |
This indicates how often should the test be executed. |
|
Host |
The host for which the test is to be configured. |
|
Port |
Refers to the port used by the Omnissa Horizon Unified Access Gateway appliance. By default, this is 9443. |
|
SSL |
By default, the appliance is SSL-enabled. This is why, the SSL flag is set to Yes by default. In case the appliance is not SSL-enabled, then set this flag to No. |
|
Install DIR |
Specify the full path to the install directory of the Omnissa Horizon Unified Access Gateway appliance. |
|
High Security |
In highly secure environments, eG Enterprise could not perform agentless monitoring on a Linux host using SSH. To enable agentless monitoring of the Linux hosts in such environments, by default, the HIGH SECURITY flag is set to Yes. This indicates that eG Enterprise will connect to the target Linux host in a more secure way and collect performance metrics. |
|
DD Frequency |
Refers to the frequency with which detailed diagnosis measures are to be generated for this test. The default is 1:1. This indicates that, by default, detailed measures will be generated every time this test runs, and also every time the test detects a problem. You can modify this frequency, if you so desire. Also, if you intend to disable the detailed diagnosis capability for this test, you can do so by specifying none against DD frequency. |
|
Detailed Diagnosis |
To make diagnosis more efficient and accurate, the eG Enterprise embeds an optional detailed diagnostic capability. With this capability, the eG agents can be configured to run detailed, more elaborate tests as and when specific problems are detected. To enable the detailed diagnosis capability of this test for a particular server, choose the On option. To disable the capability, click on the Off option. The option to selectively enable/disable the detailed diagnosis capability will be available only if the following conditions are fulfilled:
|
| Measurement | Description | Measurement Unit | Interpretation |
|---|---|---|---|
|
Total requests |
Indicates the total number of requests received by the gateway appliance to initiate sessions. |
Number |
|
|
Created sessions |
Indicates the current number of sessions that were created on the gateway appliance. |
Number |
The detailed diagnosis of this measure lists the Client IP address, Client port and the user who has created the session. |
|
UAG errors |
Indicates the number of failures encountered by the gateway appliance while initiating sessions. |
Number |
The detailed diagnosis of this measure lists the Client IP address, Client port, the user who had requested the session and the Reason for the failure. |
|
Total sessions |
Indicates the total number of sessions on the gateway appliance. |
Number |
This measure is a good indicator of load on the gateway appliance. By tracking the variations to this measure over time, you can figure out the maximum number of sessions the appliance can handle. |
|
PCoIP sessions |
Indicates the current number of PCoIP sessions. |
Number |
The detailed diagnosis of this measure lists the session launch type, resource name, user who initiated the session with domain, the resource IP address, the port, connection broker, client machine name, Client MAC address, Client IP, Client user, Client Domain, client time zone, Client ID and the operating system of the machine accessed by the client. |
|
Blast sessions |
Indicates the number of Blast sessions. |
Number |
The detailed diagnosis of this measure lists the session launch type, resource name, user who initiated the session with domain, the resource IP address, the port, connection broker, client machine name, Client MAC address, Client IP, Client user, Client Domain, client time zone, Client ID and the operating system of the machine accessed by the client. |
|
RDP sessions |
Indicates the number of RDP sessions. |
Number |
The detailed diagnosis of this measure lists the session launch type, resource name, user who initiated the session with domain, the resource IP address, the port, connection broker, client machine name, Client MAC address, Client IP, Client user, Client Domain, client time zone, Client ID and the operating system of the machine accessed by the client. |
|
Desktop sessions |
Indicates the number of desktop sessions. |
Number |
The detailed diagnosis of this measure lists the protocol, Desktop/RDSH name, user who initiated the session with domain, the Desktop/RDSH address, the port, connection broker, client machine name, Client MAC address, Client IP, Client user, Client Domain, client time zone, Client ID and the operating system of the machine accessed by the client. |
|
Application sessions |
Indicates the number of application sessions. |
Number |
The detailed diagnosis of this measure lists the protocol, Application name, user who initiated the session with domain, the Desktop/RDSH address, the port, connection broker, client machine name, Client MAC address, Client IP, Client user, Client Domain, client time zone, Client ID and the operating system of the machine accessed by the client. |
|
Terminated sessions |
Indicates the number of terminated sessions. |
Number |
The detailed diagnosis of this measure lists the Client IP address, Client port, the user who initiated the session and the reason for termination of the session. |
|
Active sessions |
Indicates the number of active sessions. |
Number |
The detailed diagnosis of this measure lists the IP address of the client, Client port and the user who has initiated the session. |
|
Unique users |
Indicates the number of unique users who have initiated session through the gateway appliance. |
Number |
The detailed diagnosis of this measure lists the name of the unique users who have initiated sessions. |
|
Unique clients |
Indicates the number of unique clients who have initiated sessions through the gateway appliance. |
Number |
The detailed diagnosis of this measure lists the Client machine name, Client MAC address, Client IP, user, Client domain, Client timezone, Client ID and the Client OS type. |
The detailed diagnosis of the Active sessions measure lists the IP address of the client, Client port and the user who has initiated the session.
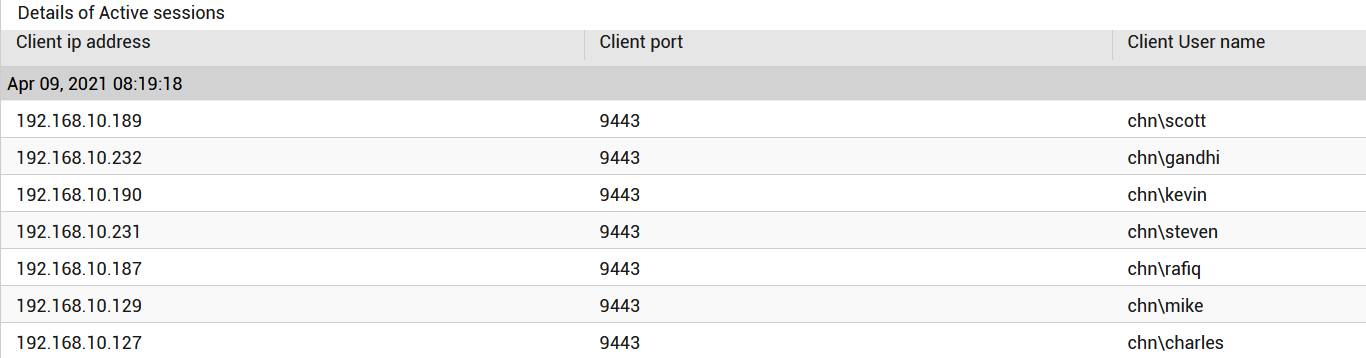
Figure 1 : The detailed diagnosis of the Active sessions measure
The detailed diagnosis of the Unique users measure lists the name of the unique users who have initiated sessions.
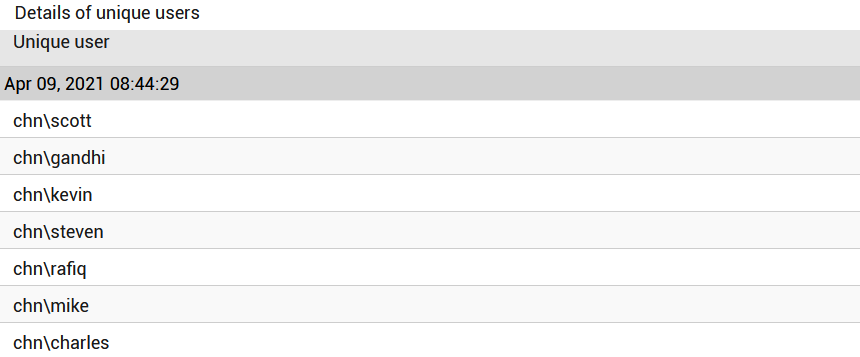
Figure 2 : The detailed diagnosis of the Unique users measure
The detailed diagnosis of the Unique clients measure lists in-depth insights into each user who is initiating the session through the gateway appliance. These details include the Client machine name, Client MAC address, Client IP, user, Client domain, Client timezone, Client ID and the Client OS type.
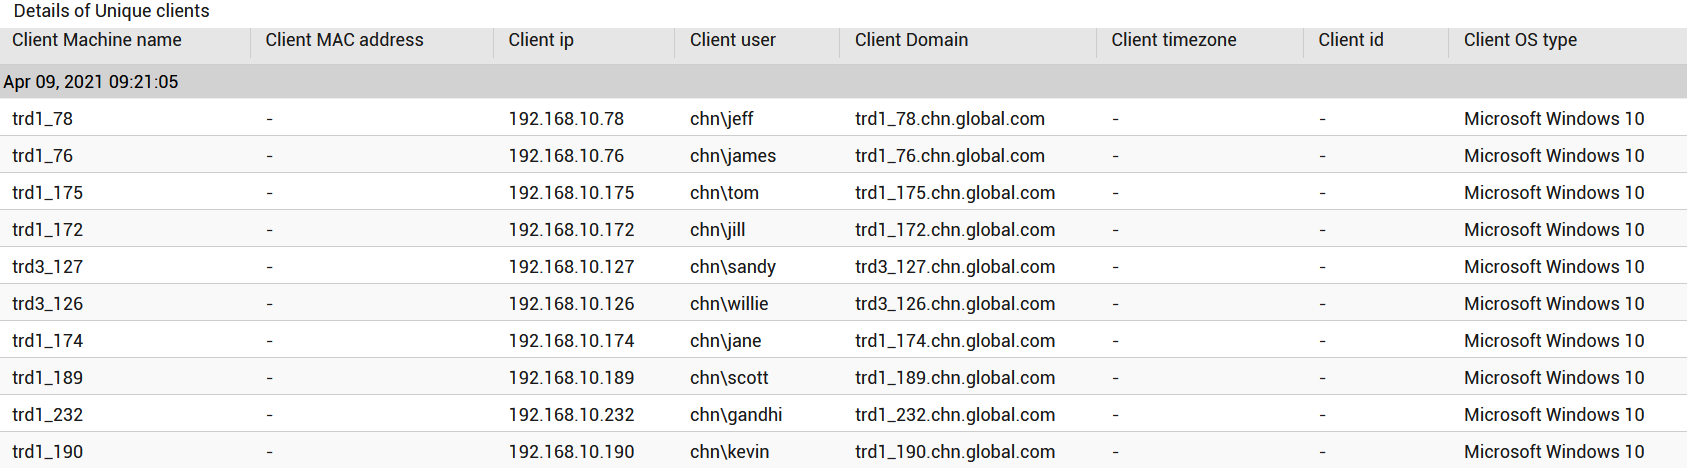
Figure 3 : The detailed diagnosis of the Unique clients measure
The detailed diagnosis of the PCoIP sessions measure offers in-depth insights into each PCoIP session initiated by the user. These details include the session launch type, resource name, user who initiated the session with domain, the resource IP address, the port, connection broker, client machine name, Client MAC address, Client IP, Client user, Client Domain, client time zone, Client ID and the operating system of the machine accessed by the client.
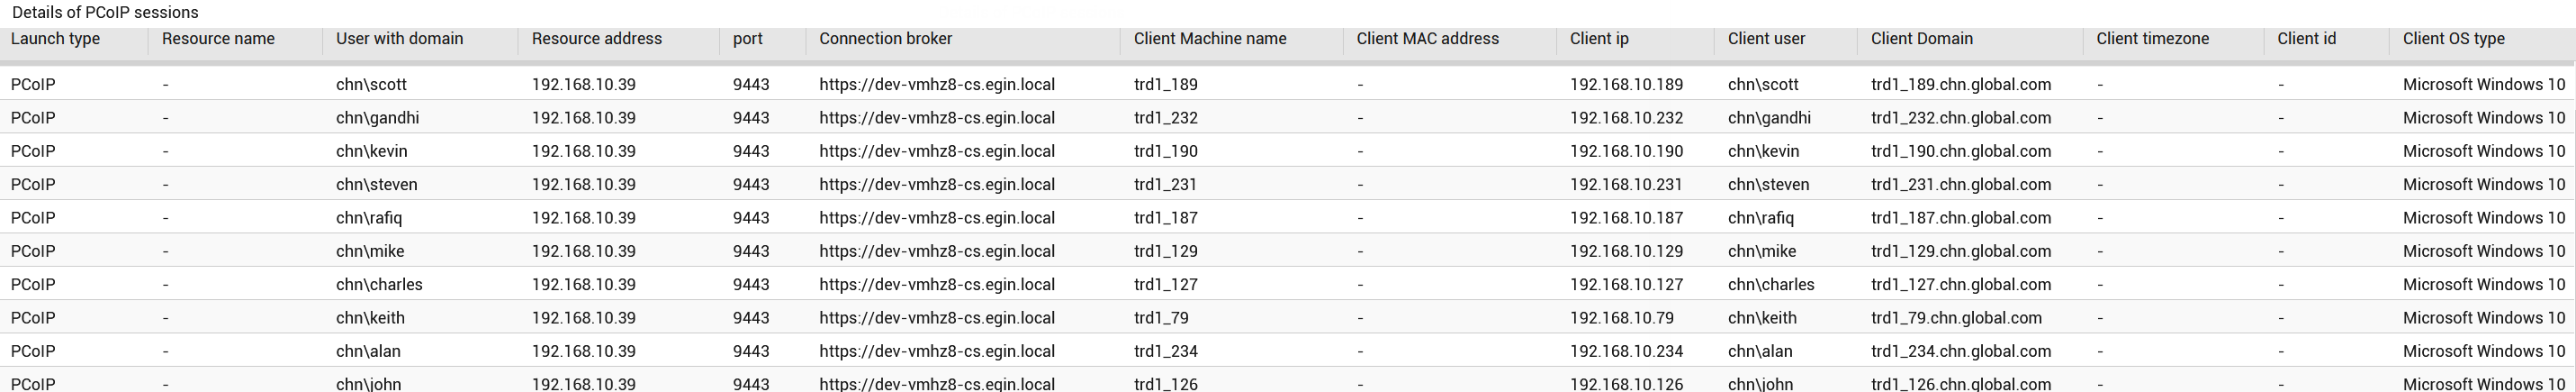
Figure 4 : The detailed diagnosis of the PCoIP sessions measure
The detailed diagnosis of the Blast sessions measure offers in-depth insights into each Blast session initiated by the user. These details include the session launch type, resource name, user who initiated the session with domain, the resource IP address, the port, connection broker, client machine name, Client MAC address, Client IP, Client user, Client Domain, client time zone, Client ID and the operating system of the machine accessed by the client.
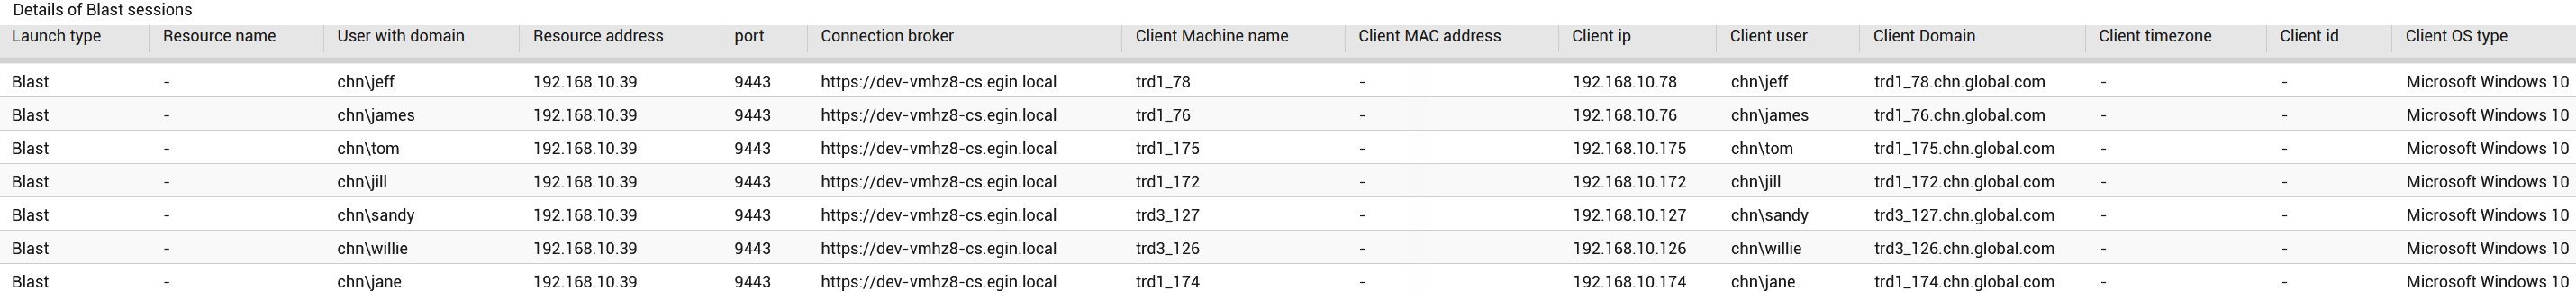
Figure 5 : The detailed diagnosis of the Blast sessions measure
The detailed diagnosis of the Desktop sessions measure offers in-depth insights into each desktopsession initiated by the user. These details include the protocol, desktop/RDSH name, user who initiated the session with domain, the Desktop/RDSH address, the port, connection broker, client machine name, Client MAC address, Client IP, Client user, Client Domain, client time zone, Client ID and the operating system of the machine accessed by the client.
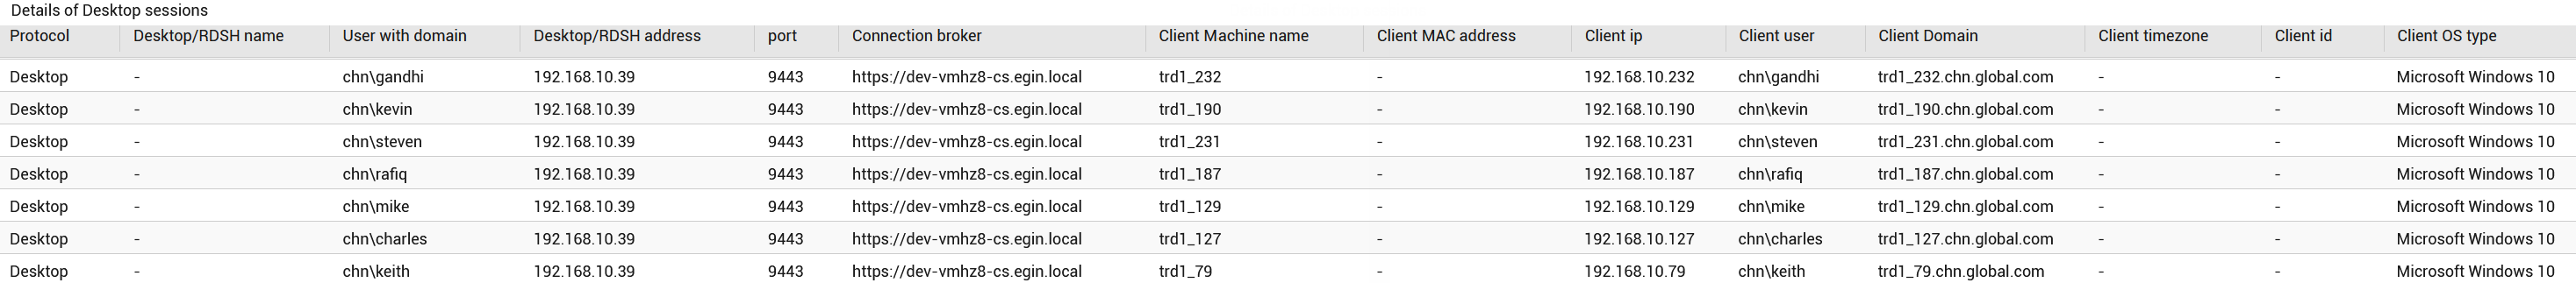
Figure 6 : The detailed diagnosis of the Desktop sessions measure
