Microsoft Yammer Dashboard
The eG Enterprise monitoring console offers a dedicated Microsoft Yammer Dashboard, out-of-the-box. The different pages of this dashboard help you find quick and accurate answers to the following questions:
- Is the Microsoft Yammer service healthy? If not, then what type of service incidents are affecting the health of the service?
- Did login fail recently?
- Are user logins taking longer than usual?
- Are there any inactive users on Microsoft Yammer?
- Which type of device was most frequently used for accessing Microsoft Yammer?
- Are there any inactive groups on Microsoft Yammer?
- Which type of user operations failed leading to poor user experience?
- Is the level of activity on Yammer abnormally high or low?
- Which type of activity is frequently performed by the users?
The dashboard also embeds smart drill-downs, which enable you to go from problem symptom to source within a click!
To access the dashboard, click on the Monitor tile and select Microsoft Yammer from the Dashboards menu. Then, move your mouse pointer over the Yammer icon in the left panel of the page that appears, and click the Service Health option within.
To view this dashboard for a particular tenant, choose that tenant from the Tenant list box at the right, top corner.
The sections that follow will discuss each page of the Microsoft Yammer dashboard in detail.
Service Health
Use the SERVICE HEALTH page (see Figure 1) to monitor the health of the Microsoft Yammer service. The Service Health page of the dashboard provides a bird's eye view of the health which includes service availability, Yammer activity details, latencies and user experience.

Figure 1 : The SERVICE HEALTH page of the Microsoft Yammer Dashboard
First up, this page indicates the current health state of the Microsoft Yammer service using intuitive text, colors, and imagery. The Service Incidents section in Figure 1 indicates the number of service incidents that are currently occurring on the Microsoft Yammer service. Unplanned service incidents can impact service availability and responsiveness. To indicate if such incidents have occurred, the Service Health page reports the number of service incidents in the Service Incidents counter.
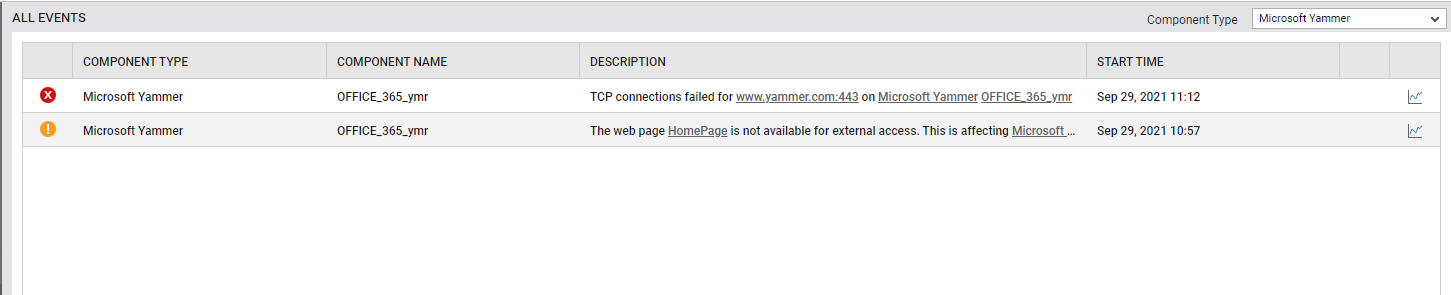
The Events counter in Figure 1 alerts you to problem events that eG Enterprise may have captured on the Microsoft Yammer service. To zoom into these events, click on the Events count. The All Events page (see Figure 2) will then open, where you can view the complete details of all eG alarms related to the Microsoft Yammer service.
The Web Availability section in Figure 1 indicates whether/not an HTTP/S connection to Microsoft Yammer is currently available. Unavailability/inaccessiblity of Yammer over the web can thus be instantly ascertained.
The Logon Status section in Figure 1 indicates whether/not logins to Microsoft Yammer were successful. The Login time section in Figure 1 indicates the time taken by a user to log into Microsoft Yammer. This helps administrators proactively detect and resolve login delays.
The Yammer Activity section in Figure 3indicates a doughnut pie chart revealing the total number of unique users who frequently liked, posted and read the messages on Microsoft Yammer. With the help of this doughnut pie chart, you can figure out which type of activity was most frequently performed by the users. The User Operations section in Figure 3 indicates the time taken by a user to post/like/delete the messages in Microsoft Yammer. Similarly, the time taken by the user to upload/delete a file in Microsoft Yammer can also be identified. Using the User Operations section, administrators can figure out which type of Yammer activity is taking too long to complete. If users complain of slowness when working with Yammer, then this section will help administrators accurately identify the exact type of user operation that is causing the slowness.
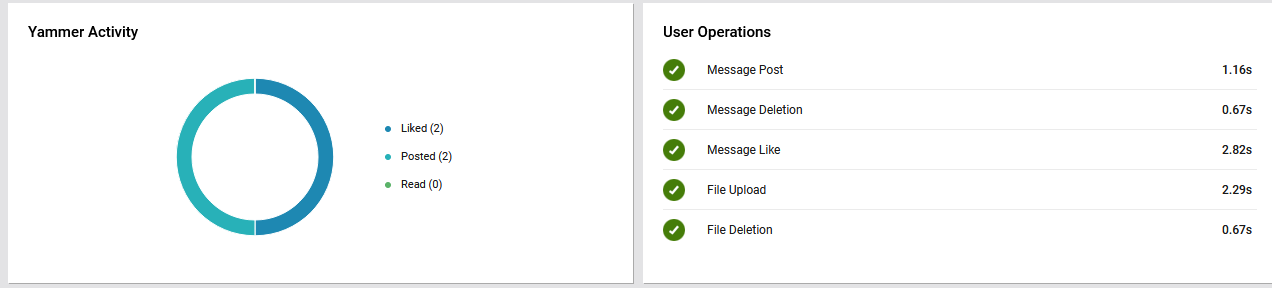
Figure 3 : Yammer activity and user operations
The Average Latency section (see Figure 4) shows the average time taken by the Yammer site to respond to TCP connection requests that it receives. This section helps the administrators to figure out when the Average Latency was maximum during the last 1 week. With the help of this graph, you can look back at the last 1 week and study how the Average Latency was maintained during that time window. In the process, you can quickly figure out how often during that time window, maximum latency was noticed.
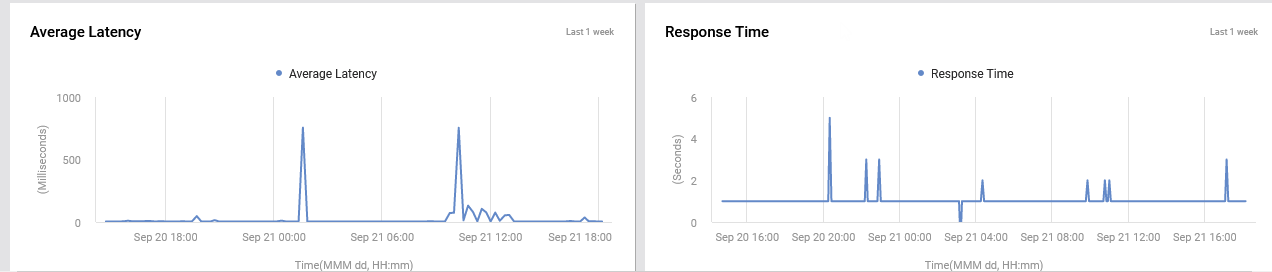
Figure 4 : Average latency and response time
The Response Time section (see Figure 4) shows the time taken by Microsoft Yammer to respond to web requests. This section helps the administrators to figure out at which time windows during the last week, Response Time was very poor.
Unplanned service incidents can impact service availability and responsiveness. To indicate if such incidents have occurred, the Service Health page reports the service incidents in the List of Service Incidents section. Using this section, you can figure out what incidents occurred and which services were impacted.
User Experience
The USER EXPERIENCE page (see Figure 5) focuses on the user interaction with Microsoft Yammer on a regular basis, which involves activities like posting messages, deleting messages, liking messages, and uploading/deleting the files in/from Microsoft Yammer.
To access the USER experience page, move your mouse pointer over the Yammer icon in the left panel, and click on the User Experience option within.
At first glance, this page reveals whether any user operation (eg., posting, reading, liking, uploading, deleting) has failed.
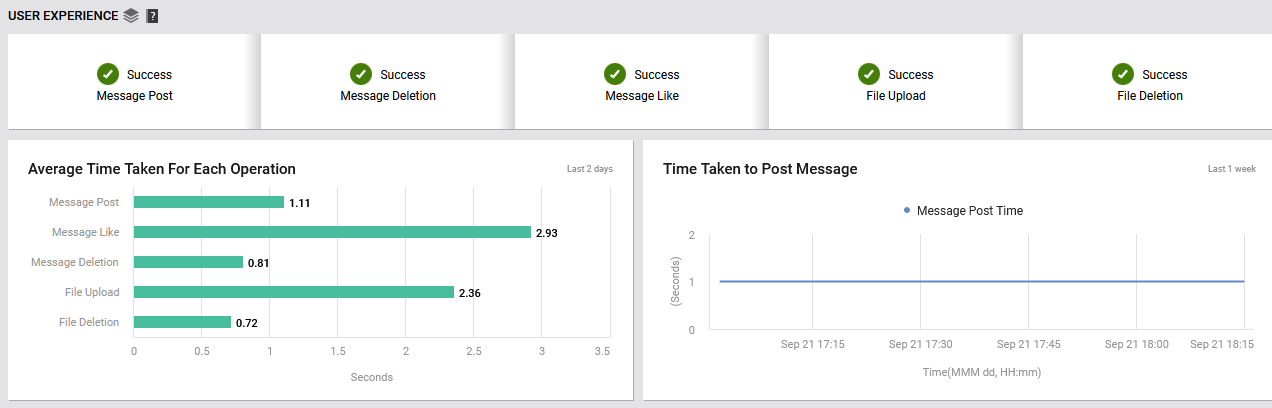
Figure 5 : User Experience Page - Average time taken for each operation and time taken to post message
The Average Time Taken For Each Operation section (see Figure 5) shows a horizontal bar chart which reveals the average time taken to post/delete/like the messages in Microsoft Yammer as well as the time taken to upload /delete the files to/from Microsoft Yammer. With the help of this graph, you can quickly figure out which operation was the slowest in the last 2 days.
If the Average Time Taken For Each Operation section reveals slowness in any user operation during the last 2 days, then you can use the Time Taken to . . .graph (see Figure 5 and Figure 6) of the corresponding operation to closely study that operation's behavior during the last week. This historical analysis will help you determine whether the slowness was consistent or sporadic.
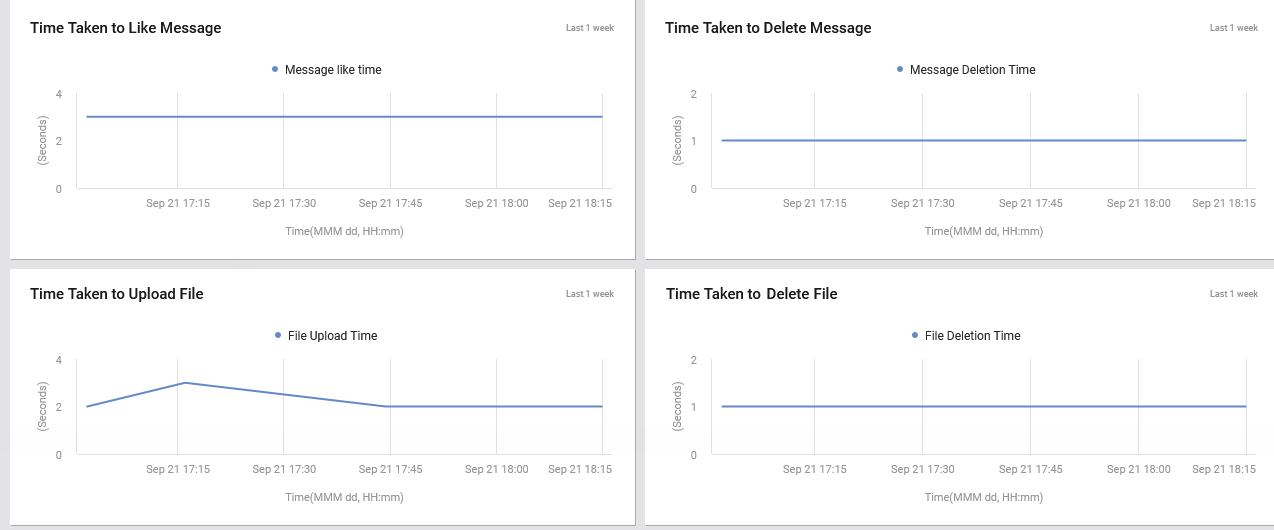
Figure 6 : Time taken to like/delete message to/from MicrosoftYammer and upload/delete files to/from Microsoft Yammer
User/Groups
The USER/GROUPS page (see Figure 7) provides a comprehensive view of the usage of Microsoft Yammer.
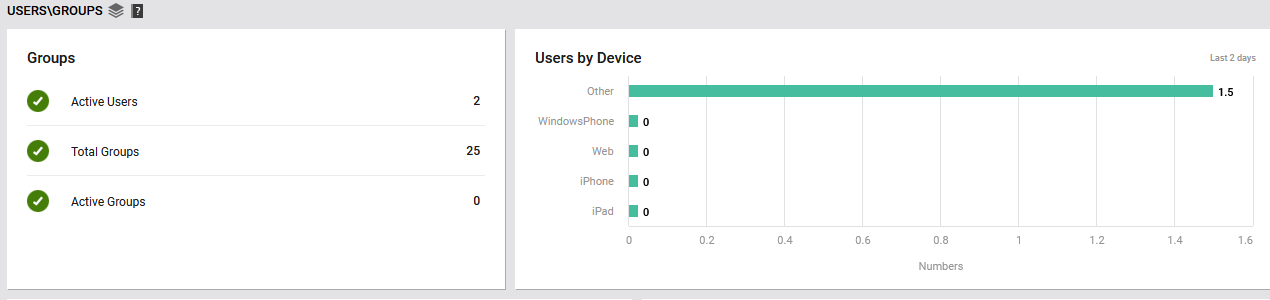
Figure 7 : User/Groups Page - Groups and users by device type in Microsoft Yammer
To access the USERS/GROUPS page, move your mouse pointer over the Yammer icon in the left panel, and click on the Users/Groups option within.
The Groups section in USER/GROUPS page (see Figure 7) shows the number of Active Users, Total Groups and Active Groups in Microsoft Yammer. This way, you can quickly know how many groups are inactive on Yammer.
The Users by Device section in USER/GROUPS page (see Figure 7) focuses on the devices that the users use to connect to Microsoft Yammer. A quick look at the dashboard will reveal how actively Microsoft Yammer has been used, and what type of devices were used to access it.
The Users section in Figure 8 indicates a doughnut pie chart which represents the total number of users who are currently active/inactive in Microsoft Yammer. If there are too many inactive users, it is a cause for concern as it could imply that Microsoft Yammer is losing its popularity.
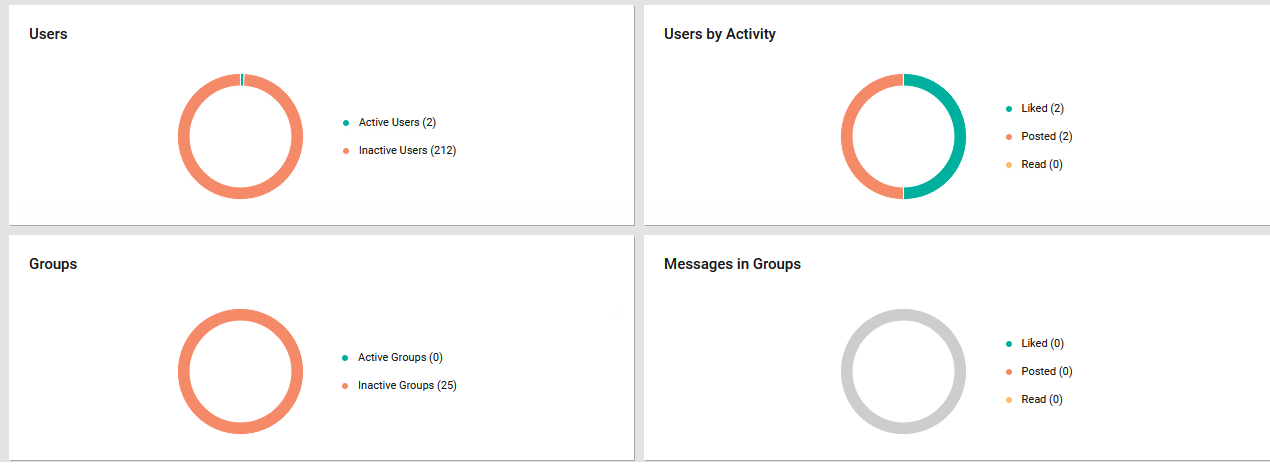
Figure 8 : Status count based on Users, Users by Activity, Groups and Message in Groups
The Groupssection in Figure 8 shows a doughnut pie chart which represents the number of communities/groups that are currently active/inactive in Microsoft Yammer. The inactive groups/communities can thus be quickly isolated.
The Message in Groups section in Figure 3 reveals a doughnut pie chart which represents the total number of messages that were liked/posted/read by the users in all communities/groups created in Microsoft Yammer. This is a good indicator of the level of user activity in Microsoft Yammer.
