AWS OpsWorks Test
Cloud-based computing usually involves groups of AWS resources, such as instances and Amazon Relational Database Service (RDS) instances. For example, a web application typically requires application servers, database servers, load balancers, and other resources. This group of instances is typically called a stack.
AWS OpsWorks Stacks, the original service, provides a simple and flexible way to create and manage stacks and applications. AWS OpsWorks Stacks lets you deploy and monitor applications in your stacks. You can create stacks that help you manage cloud resources by grouping them.
For example, a stack whose purpose is to serve web applications might look something like the following:
- A set of application server instances, each of which handles a portion of the incoming traffic.
- A load balancer instance, which takes incoming traffic and distributes it across the application servers.
- A database instance, which serves as a back-end data store for the application servers.
A common practice is to have multiple stacks that represent different environments. A typical set of stacks consists of:
- A development stack to be used by developers to add features, fix bugs, and perform other development and maintenance tasks.
- A staging stack to verify updates or fixes before exposing them publicly.
- A production stack, which is the public-facing version that handles incoming requests from users.
The load on a stack will vary according to the environment it represents. For instance, a production stack that front-ends requests from users, may see more traffic than a development stack that is used only by a small set of developers. The optimal performance of a stack therefore relies on whether/not that stack is sized with sufficient resources (CPU and memory) to handle its load. If a stack is not sized commensurate to its load, the performance of that stack and the application it supports will be adversely impacted! To avoid this, administrators can use the AWS OpsWorks test!
Using the AWS OpsWorks test, adminstrators can track the load on a stack, measure how much CPU and memory that stack used to process this load, and can thus proactively detect potential resource contentions and/or overload conditions. With the help of the useful pointers provided by this test, administrators can easily pinpoint stacks that are improperly sized in terms of CPU and memory and quickly initiate measures to right-size them.
Optionally, you can configure this test to report the load and resource usage metrics for individual layers or instances that constitute a stack. A layer represents a set of instances that serve a particular purpose, such as serving applications or hosting a database server. Layers depend on Chef recipes to handle tasks such as installing packages on instances, deploying apps, and running scripts.
Instance-wise insights into performance reveal if there are enough instances in a stack to handle user requests. Administrators can then decide whether/not to add more instances to a stack. Layer-wise insights into performance enable administrators to understand whether resources can be managed better if layer configuration is fine-tuned.
Target of the test: Amazon Cloud
Agent deploying the test : A remote agent
Outputs of the test : One set of results for each stack/layer/instance
First-level descriptor: AWS Region
Second-level descriptor: StackID/LayerID/InstanceID, depending upon the option chosen from the OpsWorks Filter Name parameter of this test.
| Parameter | Description |
|---|---|
|
Test Period |
How often should the test be executed. |
|
Host |
The host for which the test is to be configured. |
|
Access Type |
eG Enterprise monitors the AWS cloud using AWS API. By default, the eG agent accesses the AWS API using a valid AWS account ID, which is assigned a special role that is specifically created for monitoring purposes. Accordingly, the Access Type parameter is set to Role by default. Furthermore, to enable the eG agent to use this default access approach, you will have to configure the eG tests with a valid AWS Account ID to Monitor and the special AWS Role Name you created for monitoring purposes.
Some AWS cloud environments however, may not support the role-based approach Note that the Secret option may not be ideal when monitoring high-security cloud environments. This is because, such environments may issue a security mandate, which would require administrators to change the Access Key and Secret Key, often. Because of the dynamicity of the key-based approach, Amazon recommends the Role-based approach for accessing the AWS API. |
|
AWS Account ID to Monitor |
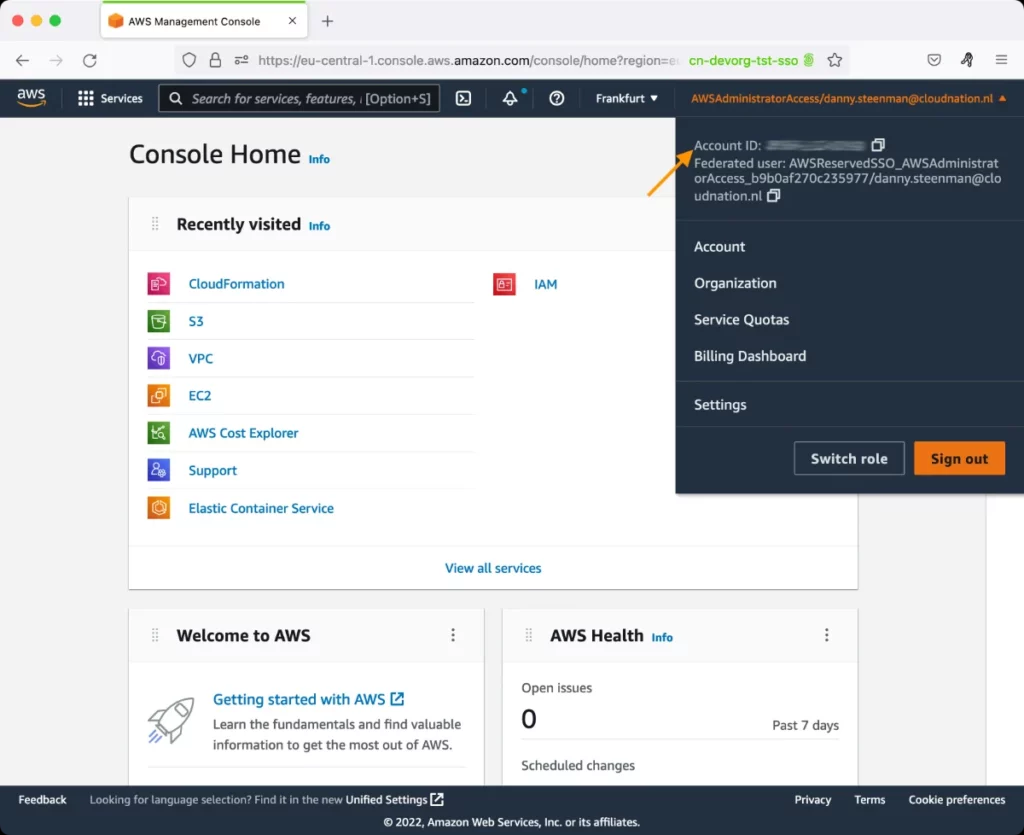
This parameter appears only when the Access Type parameter is set to Role. Specify the AWS Account ID that the eG agent should use for connecting and making requests to the AWS API. To determine your AWS Account ID, follow the steps below:
|
|
AWS Role Name |
This parameter appears when the Access Type parameter is set to Role. Specify the name of the role that you have specifically created on the AWS cloud for monitoring purposes. The eG agent uses this role and the configured Account ID to connect to the AWS Cloud and pull the required metrics. To know how to create such a role, refer to Creating a New Role. |
|
AWS Access Key, AWS Secret Key, Confirm AWS Access Key, Confirm AWS Secret Key |
These parameters appear only when the Access Type parameter is set to Secret.To monitor an Amazon cloud instance using the Secret approach, the eG agent has to be configured with the access key and secret key of a user with a valid AWS account. For this purpose, we recommend that you create a special user on the AWS cloud, obtain the access and secret keys of this user, and configure this test with these keys. The procedure for this has been detailed in the Obtaining an Access key and Secret key topic. Make sure you reconfirm the access and secret keys you provide here by retyping it in the corresponding Confirm text boxes. |
|
Proxy Host and Proxy Port |
In some environments, all communication with the AWS cloud and its regions could be routed through a proxy server. In such environments, you should make sure that the eG agent connects to the cloud via the proxy server and collects metrics. To enable metrics collection via a proxy, specify the IP address of the proxy server and the port at which the server listens against the Proxy Host and Proxy Port parameters. By default, these parameters are set to none , indicating that the eG agent is not configured to communicate via a proxy, by default. |
|
Proxy User Name, Proxy Password, and Confirm Password |
If the proxy server requires authentication, then, specify a valid proxy user name and password in the Proxy User Name and Proxy Password parameters, respectively. Then, confirm the password by retyping it in the Confirm Password text box. By default, these parameters are set to none, indicating that the proxy sever does not require authentication by default. |
|
Proxy Domain and Proxy Workstation |
If a Windows NTLM proxy is to be configured for use, then additionally, you will have to configure the Windows domain name and the Windows workstation name required for the same against the Proxy Domain and Proxy Workstation parameters. If the environment does not support a Windows NTLM proxy, set these parameters to none. |
|
Exclude Region |
Here, you can provide a comma-separated list of region names or patterns of region names that you do not want to monitor. For instance, to exclude regions with names that contain 'east' and 'west' from monitoring, your specification should be: *east*,*west* |
|
Default Connection Region |
By default, this test connects to the endpoint URL of the us-east-1 region to collect the required metrics. If the default us-east-1 region is not enabled in the target environment, then, for this test to collect the required metrics, specify the region that is enabled in the target environment. |
|
OpsWorks Filter Name |
By default, this parameter is set to StackID. This means that by default, this test will report metrics for each stack. If required, you can override this default setting by setting the OpsWorks Filter Name parameter to one of the following:
|
|
Measurement |
Description |
Measurement Unit |
Interpretation |
|---|---|---|---|
|
Idle CPU |
By default, this measure represents the percentage of time for this stack did not use its CPU. If the OpsWorks Filter Name is set to LayerID, then this measure represents the percentage of time for which the CPU resources of the instances in this layer were idle. If the OpsWorks Filter Name is set to InstanceID, then this measure represents the percentage of time for which the CPU of this instance was idle. |
Percent |
If the value of this measure is consistently close to 100% for a stack, it could mean that the instances in that stack are probably sized with more CPU than it requires. On the other hand, if the value of this measure is consistently low stack, it could mean that instances in the stack are utilizing their CPU resources excessively. To know which instances are hogging the CPU, you may want to configure this test to report metrics for each instance by setting the OpsWorks Filter Name to InstanceID. |
|
Nice CPU |
By default, this measure represents the percentage of time that the CPU of this stack is handling processes with a positive nice value. If the OpsWorks Filter Name is set to LayerID, then this measure represents the percentage of time for which the CPU of this layer was handling processes with a positive nice value. If the OpsWorks Filter Name is set to InstanceID, then this measure represents the percentage of time for which the CPU of this instance was handling processes with a positive nice value. |
Percent |
nice is a program found on Unix and Unix-like operating systems such as Linux. which is used to invoke a utility or shell script with a particular priority, thus giving the process more or less CPU time than other processes. A niceness of −20 is the highest priority and 19 is the lowest priority. If the value of this measure is constantly close to or equal to 100% for a stack, it implies that most of the time the majority of the instances in this stack are utilizing CPU for processing requests of a lower priority only. On the other hand, if the value of this measure is very low consistently, it means that high-priority programs are hogging the CPU, and not the low-priority programs. In the event of a CPU contention, you can use the value of this measure to determine where is your CPU time being spent - in progressing low-priority programs? or high-priority ones? |
|
Steal CPU |
By default, this measure represents the percentage of time that the instances of this stack waited for the hypervisor to allocate physical CPU resources. If the OpsWorks Filter Name is set to LayerID, then this measure represents the percentage of time the instances in this layer waited for the hypervisor to allocate physical CPU resources. If the OpsWorks Filter Name is set to InstanceID, then this measure represents the number of times this instance waited for the hypervisor to allocate physical CPU resources. |
Percent |
If the value of this measure is greater than 10% for a stack for over 20 minutes, it means that a majority of the instances in the stack are waiting too long for physical CPU. This can cause the instances to run slower than they should. The probable causes for spikes in CPU steal time are as follows:
Therefore, when you notice a consistent increase in the value of this measure, it is good practice to do one of the following:
|
|
System CPU |
By default, this measure indicates the percentage of time the instances in this stack used CPU for processing system operations. If the OpsWorks Filter Name is set to LayerID, then this measure represents the percentage of time the instances in this layer used CPU for handling system operations. If the OpsWorks Filter Name is set to InstanceID, then this measure represents the percentage of time this instance used CPU for handling system operations. |
Percent |
If instances in a stack are experiencing slowness, you may want to compare the value of these measures across instances to know which instance is hogging the CPU and while doing what - when processing system operations? user operations? or just waiting for I/O to complete? |
|
User CPU |
By default, this measure indicates the percentage of time the instances in this stack used CPU for processing user operations. If the OpsWorks Filter Name is set to LayerID, then this measure represents the percentage of time the instances in this layer used CPU for handling user operations. If the OpsWorks Filter Name is set to InstanceID, then this measure represents the percentage of time this instance used CPU for handling user operations. |
Percent |
|
|
WaitIO CPU |
By default, this measure indicates the percentage of time for which the CPU was ready to run, but could not because it was waiting for input/output operations on the instances of this stack to complete. If the OpsWorks Filter Name is set to LayerID, then this measure indicates the percentage of time for which the CPU was ready to run, but could not because it was waiting for input/output operations on the instances of this layer to complete. If the OpsWorks Filter Name is set to InstanceID, then this measure indicates the percentage of time for which the CPU was ready to run, but could not because it was waiting for input/output operations on this instance to complete. |
Percent |
|
|
Buffered memory |
By default, this measure represents the total amount of memory that is buffered for the instances in this stack. If the OpsWorks Filter Name is set to LayerID, then this measure represents the total amount of memory that is buffered for the instances in this layer. If the OpsWorks Filter Name is set to InstanceID, then this measure represents the total amount of memory that is buffered for this instance. |
KB |
|
|
Cached memory |
By default, this measure represents the total amount of memory that is cached for the instances in this stack. If the OpsWorks Filter Name is set to LayerID, then this measure represents the total amount of memory that is cached for the instances in this layer. If the OpsWorks Filter Name is set to InstanceID, then this measure represents the total amount of memory that is cached for this instance. |
KB |
|
|
Free memory |
By default, this measure represents the total amount of memory that the instances in this stack are still to use. If the OpsWorks Filter Name is set to LayerID, then this measure represents the total amount of memory that the instances in this layer are yet to use. If the OpsWorks Filter Name is set to InstanceID, then this measure represents the total amount of memory that is still unused by this instance. |
KB |
Ideally, the value of this measure should be close to the value of the Total memory measure. A consistent drop in the value of this measure is a cause for concern, as it implies that memory is been steadily drained. A very low value for this measure is indicative of excessive memory usage, which can significantly affect the performance of the instances. |
|
Swap memory |
By default, this measure represents the total amount of swap memory available for the instances in this stack. If the OpsWorks Filter Name is set to LayerID, then this measure represents the total amount of swap memory available for the instances in this layer. If the OpsWorks Filter Name is set to InstanceID, then this measure represents the total amount of swap memory that is available for this instance. |
KB |
An unusually high value for the swap usage can indicate a memory bottleneck. |
|
Total memory |
By default, this measure represents the total memory capacity of this stack across all its instances. If the OpsWorks Filter Name is set to LayerID, then this measure represents the total memory capacity of this layer across its instances. If the OpsWorks Filter Name is set to InstanceID, then this measure represents the total memory capacity of this instance. |
KB |
|
|
Used memory |
By default, this measure represents the total memory used by all instances in this stack. If the OpsWorks Filter Name is set to LayerID, then this measure represents the total memory used by all instances in this layer. If the OpsWorks Filter Name is set to InstanceID, then this measure represents the total memory used by this instance. |
KB |
Ideally, the value of this measure should be low. A consistent increase in the value of this measure is a cause for concern, as it implies that memory is been steadily drained. If the value of this measure is close to or equal to the value of the Total memory measure, it indicates excessive memory usage by instances. This can significantly affect the performance of the instances. To avoid this, make sure that your instances are sized on the basis of their load. |
|
Load averaged over 1-minute |
By default, this measure represents the load on the instances in this stack, averaged over a 1-minute window. If the OpsWorks Filter Name is set to LayerID, then this measure represents the load on the instances in this layer, averaged over a 1-minute time window. If the OpsWorks Filter Name is set to InstanceID, then this measure represents the load on this instance, averaged over a 1-minute time window. |
Percent |
Compare the value of these measures across stacks to identify that stack that is consistently handling high traffic. As your incoming traffic varies, your stack may have either too few instances to comfortably handle the load or more instances than necessary. You can save both time and money by using time-based or load-based instances to automatically increase or decrease a layer's instances so that you always have enough instances to adequately handle incoming traffic without paying for unneeded capacity. Automatic scaling is based on two instance types, which adjust a layer's online instances based on different criteria:
They allow a stack to handle loads that follow a predictable pattern by including instances that run only at certain times or on certain days. For example, you could start some instances after 6PM to perform nightly backup tasks or stop some instances on weekends when traffic is lower. A common practice is to use all three instance types together, as follows.
|
|
Load averaged over 5-minute |
By default, this measure represents the load on the instances in this stack, averaged over a 5-minute window. If the OpsWorks Filter Name is set to LayerID, then this measure represents the load on the instances in this layer, averaged over a 5-minute time window. If the OpsWorks Filter Name is set to InstanceID, then this measure represents the load on this instance, averaged over a 5-minute time window. |
Percent |
|
|
Load averaged over 15-minute |
By default, this measure represents the load on the instances in this stack, averaged over a 15-minute window. If the OpsWorks Filter Name is set to LayerID, then this measure represents the load on the instances in this layer, averaged over a 15-minute time window. If the OpsWorks Filter Name is set to InstanceID, then this measure represents the load on this instance, averaged over a 15-minute time window. |
Percent |
|
|
Active processes |
By default, this measure represents the number of processes currently active across all instances in this stack. If the OpsWorks Filter Name is set to LayerID, then this measure represents the number of processes currently active across all instances in this layer. If the OpsWorks Filter Name is set to InstanceID, then this measure represents the number of processes currently active on this instance. |
Number |
This is a good indicator of the current workload of a stack / layer / instance. |