Node.js Errors Test
Applications running in Node.js will generally experience four categories of errors:
-
Standard JavaScript errors such as <EvalError>, <SyntaxError>, <RangeError>, <ReferenceError>, <TypeError>, and <URIError>.
-
System errors triggered by underlying operating system constraints such as attempting to open a file that does not exist or attempting to send data over a closed socket.
-
User-specified errors triggered by application code.
-
AssertionErrors are a special class of error that can be triggered when Node.js detects an exceptional logic violation that should never occur. These are raised typically by the node:assert module.
If too many errors are encountered by the target Node.js server, then, it may be an indication that the target server is vulnerable and requires immediate troubleshooting. To aid administrators proactively identify the errors and initiate remedial measures much before users complain of errors, eG Enterprise offers the Node.js Errors test.
This test reports the count of errors encountered by each instance of the target Node.js server. Administrators can use the detailed diagnostics to identify the exact time at which the errors were encountered and the error message that was thrown. Using this information, administrators can initiate troubleshooting process at a faster pace much before users complain.
Target of the test : A Node.js V8 Engine
Agent deploying the test : An internal/remote agent
Outputs of the test : One set of results for every instance of the target Node.js server being monitored
| Parameter | Description |
|---|---|
|
Test Period |
How often should the test be executed. |
|
Host |
The IP address of the host for which this test is to be configured. |
|
Port |
The port at which the target Host listens to. By default this is 3000. |
|
DD Frequency |
Refers to the frequency with which detailed diagnosis measures are to be generated for this test. The default is 1:1. This indicates that, by default, detailed measures will be generated every time this test runs, and also every time the test detects a problem. You can modify this frequency, if you so desire. Also, if you intend to disable the detailed diagnosis capability for this test, you can do so by specifying none against DD frequency. |
|
Detailed Diagnosis |
To make diagnosis more efficient and accurate, the eG Enterprise embeds an optional detailed diagnostic capability. With this capability, the eG agents can be configured to run detailed, more elaborate tests as and when specific problems are detected. To enable the detailed diagnosis capability of this test for a particular server, choose the On option. To disable the capability, click on the Off option. The option to selectively enable/disable the detailed diagnosis capability will be available only if the following conditions are fulfilled:
|
| Measurement | Description | Measurement Unit | Interpretation |
|---|---|---|---|
|
Number of errors |
Indicates the number of errors i.e., uncaught exceptions encountered by this instance. |
Number |
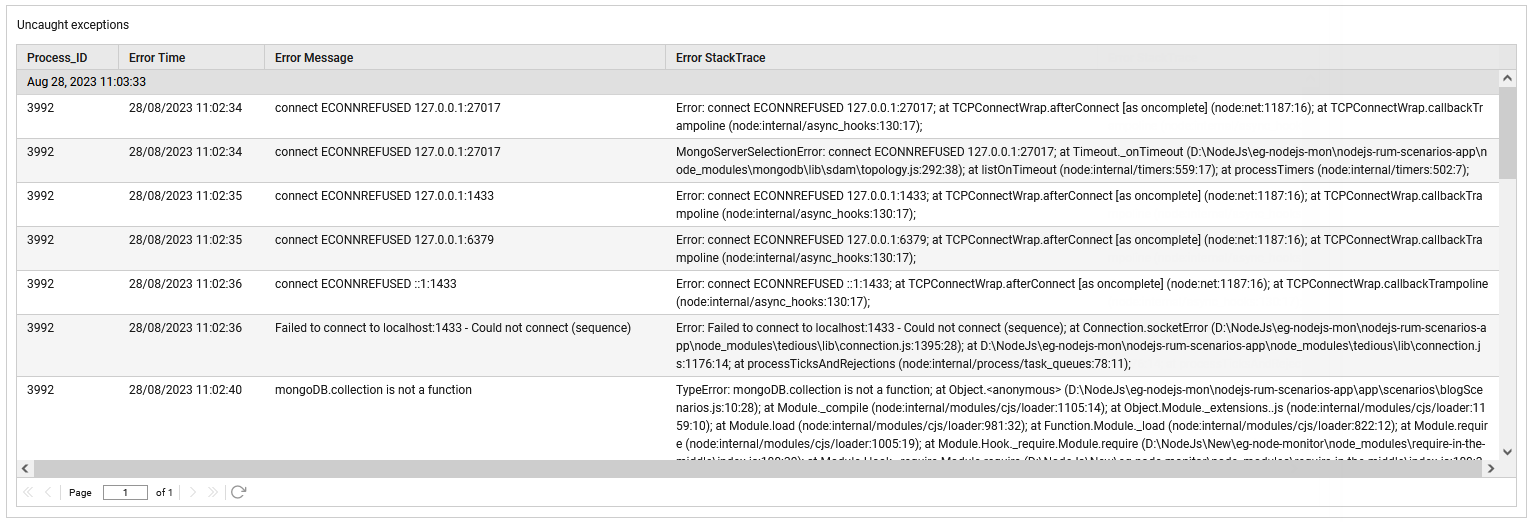
Ideally, the value of this measure should be zero. A sudden/gradual increase in the value of this measure indicates a problem condition requiring further investigation. The detailed diagnosis of this measure lists the Process ID, the time at which each error was encountered, the error message and the stack trace of the error. |
The detailed diagnosis of the Number of errors measure lists the Process ID, the time at which each error was encountered, the error message and the stack trace of each error.

Figure 1 : The detailed diagnosis of the Number of errors measure