Oracle Sessions Test
In the database context, the connection between the user process and the server process is called a session. The server process communicates with the connected user process and performs tasks on behalf of the users. The Oracle Sessions test is used by an eG agent to track user activity related to a database server instance.
Note:
This test is applicable only for PDB (Pluggable Database) configuration of an Oracle Database with Multi-tenant support.
Target of the test : An Oracle server
Agent deploying the test : An internal agent
Outputs of the test : One set of results for every SID monitored.
| Parameter | Description |
|---|---|
|
Test period |
How often should the test be executed |
|
Host |
The host for which the test is to be configured. |
|
Port |
The port on which the server is listening. |
|
Username |
In order to monitor an Oracle database server, a special database user account has to be created in every Oracle database instance that requires monitoring. A Click here hyperlink is available in the test configuration page, using which a new oracle database user can be created. Alternatively, you can manually create the special database user. When doing so, ensure that this user is vested with the select_catalog_role and create session privileges. The sample script we recommend for user creation (in Oracle database server versions before 12c) for eG monitoring is: create user oraeg identified by oraeg create role oratest; grant create session to oratest; grant select_catalog_role to oratest; grant oratest to oraeg; The sample script we recommend for user creation (in Oracle database server 12c) for eG monitoring is: alter session set container=<Oracle_service_name>; create user <user_name>identified by <user_password> container=current default tablespace <name_of_default_tablespace> temporary tablespace <name_of_temporary_tablespace>; Grant create session to <user_name>; Grant select_catalog_role to <user_name>; The name of this user has to be specified here. |
|
Password |
Specify the password of the specified database user. |
|
Confirm Password |
Confirm the Password by retyping it here. |
|
IsPassive |
If the value chosen is Yes, then the Oracle server under consideration is a passive server in an Oracle cluster. No alerts will be generated if the server is not running. Measures will be reported as “Not applicable" by the agent if the server is not up. |
|
SSL |
By default, this flag is set to No, as the target Oracle database is not SSL-enabled by default. If the target database is SSL-enabled, then set this flag to Yes. |
|
SSL Cipher |
This parameter is applicable only if the target Oracle database is SSL-enabled, if not, set this parameter to none. A cipher suite is a set of cryptographic algorithms that are used before a client application and server exchange information over an SSL/TLS connection. It consist of sets of instructions on how to secure a network through SSL (Secure Sockets Layer) or TLS (Transport Layer Security). In this text box, provide a comma-seperated list of cipher suites that are allowed for SSL/TLS connection to the target database. By default, this parameter is set to none. |
|
Truststore File |
This parameter is applicable only if the target Oracle database is SSL-enabled, if not, set this parameter to none. TrustStore is used to store certificates from Certified Authorities (CA) that verify and authenticate the certificate presented by the server in an SSL connection. Therefore, the eG agent should have access to the truststore where the certificates are stored to authenticate and connect with the target database and collect metrics. For this, first import the certificates into the following default location <eG_INSTALL_DIR>/lib/security/mytruststore.jks. To know how to import the certificate into the truststore, refer toPre-requisites for monitoring Oracle Cluster. Then, provide the truststore file name in this text box. For example: mytruststore.jks. By default, none is specified against this text box. |
|
Truststore Type |
This parameter is applicable only if the target Oracle database is SSL-enabled, if not, set this parameter to none.Specify the type of truststore that contains the certificates for server authentication in this text box. For eg.,JKS. By default, this parameter is set to the value none. |
|
Truststore Password |
This parameter is applicable only if the target Oracle database is SSL-enabled, if not, set this parameter to none. If a Truststore File name is provided, then, in this text box, provide the password that is used to obtain the associated certificate details from the Truststore File. By default, this parameter is set to none. |
|
Keystore File |
This parameter is applicable only if the target Oracle database is SSL-enabled, if not, set this parameter to none. Keystore contains the private keys for the certificates that the client can provide to the server upon request. eG agent requires access to the keystore where client certificate is stored to send that to the server so that the server validates the certificate against the one contained in its trustore. For this purpose, first create the client certificate in the following default location /opt/egurkha/jre/lib/security/egmqsslstore.jks. |
|
Keystore Password |
This parameter is applicable only if the target Oracle database is SSL-enabled, if not, set this parameter to none. If a Keystore File name or file path is provided, then, in this text box, provide the password that is used to obtain the associated certificate details from the Keystore File. |
|
Confirm Password |
Confirm the Password for Keystore by retyping it here. |
|
DD Frequency |
Refers to the frequency with which detailed diagnosis measures are to be generated for this test. The default is 1:1. This indicates that, by default, detailed measures will be generated every time this test runs, and also every time the test detects a problem. You can modify this frequency, if you so desire. Also, if you intend to disable the detailed diagnosis capability for this test, you can do so by specifying none against DD frequency. |
|
Detailed Diagnosis |
To make diagnosis more efficient and accurate, the eG Enterprise embeds an optional detailed diagnostic capability. With this capability, the eG agents can be configured to run detailed, more elaborate tests as and when specific problems are detected. To enable the detailed diagnosis capability of this test for a particular server, choose the On option. To disable the capability, click on the Off option. The option to selectively enable/disable the detailed diagnosis capability will be available only if the following conditions are fulfilled:
|
| Measurement | Description | Measurement Unit | Interpretation |
|---|---|---|---|
|
Total sessions: |
Indicates the total number of users connected to the database server. |
Number |
A high value may indicate that there is a high load on the server. |
|
Active sessions: |
Indicates the number of sessions that are currently accessing the database. |
Number |
A high value may indicate that there is a high load on the server. |
|
Background sessions: |
Indicates the number of sessions that are created when the database starts. |
Number |
A high value may indicate that there is a high load on the server. The detailed diagnosis capability, if enabled, lists all the background sessions. |
|
Blocked sessions: |
Indicates the number of sessions that were blocked in this database. |
Number |
Blocking occurs when one session holds a lock on a resource that another session is requesting. As a result, the requesting session will be blocked - it will hang until the holding session gives up the locked resource. In almost every case, blocking is avoidable. In fact, if you find that your session is blocked in an interactive application, then you have probably been suffering from the lost update bug as well, perhaps without realizing it. That is, your application logic is flawed and that is the cause of blocking. The five common DML statements that will block in the database are INSERT, UPDATE, DELETE, MERGE and SELECT FOR UPDATE. Ideally, the value of this measure should be zero. The detailed diagnosis capability, if enabled, lists all the blocked sessions of this database. |
|
Cached sessions: |
Indicates the number of sessions that were temporarily cached for use by this database. |
Number |
A high value may indicate that there is a high load on the server. The detailed diagnosis capability, if enabled, lists all the cached sessions of this database. |
|
Inactive sessions: |
Indicates the number of sessions that were inactive in this database. |
Number |
Ideally, the value of this measure should be zero. The detailed diagnosis capability, if enabled, lists all the inactive sessions in this database. |
|
Killed sessions: |
Indicates the number of inactive sessions that were terminated in this database. |
Number |
When a session is terminated, any active transactions of the session are rolled back, and resources held by the session (such as locks and memory areas) are immediately released and available to other sessions. A low value is desired for this measure. The detailed diagnosis capability, if enabled, lists all the sessions that were killed in this database. |
|
Sniped sessions: |
Indicates the number of sessions that were idle for a period more than the profile’s maximum idle time and were waiting for a response from the client. |
Number |
The idle time is the time limit that is provided against the IDLE_TIME parameter in the user’s profile or the default profile. A low value is desired for this measure. The detailed diagnosis capability, if enabled, lists all the sniped sessions of this database. |
The detailed diagnosis of the Total sessions measure, if enabled, lists all the current user sessions to the Oracle server (see Figure 1). Using this information, administrators to the database can identify the number of user sessions that are inactive, and can terminate such sessions.
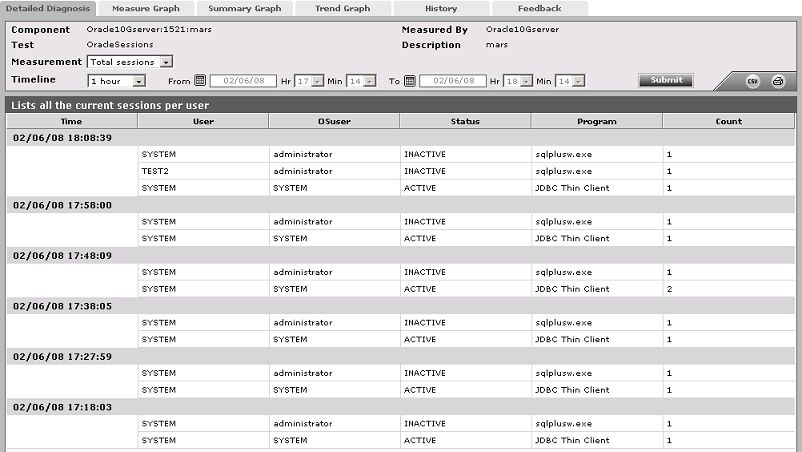
Figure 1 : The detailed diagnosis of the Total sessions measure
The detailed diagnosis of the Active sessions measure, if enabled, lists all the active user sessions to the Oracle server (see Figure 2).
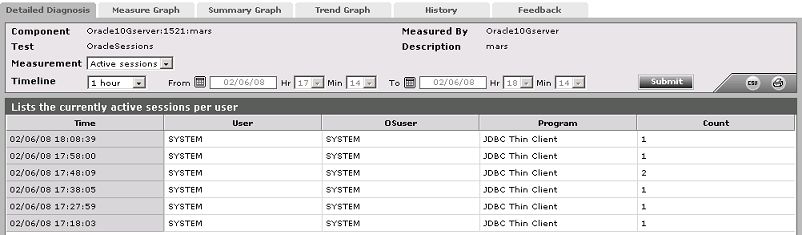
Figure 2 : The detailed diagnosis of the Active sessions measure