Monitoring the PostgreSQL Server
eG Enterprise offers a 100%, web-based PostgreSQL monitoring model (see Figure 1) that provides indepth insights into the performance and problems related to the PostgreSQL database server. This model can be used for monitoring PostgreSQL version 9.0 onwards.
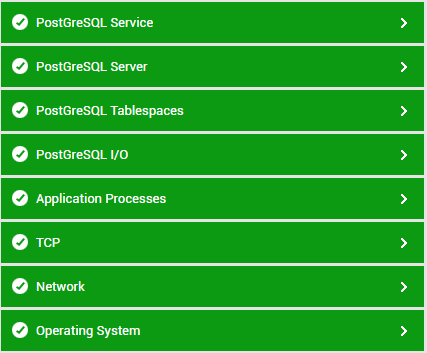
Figure 1 : Layermodel of the PostgresSQL database server
This model can be configured to employ agent-based or agentless techniques to periodically check the status of critical database operations and proactively report problems. These metrics enable database administrators to find quick and accurate answers to the following performance queries:
- Is the database server available? If so, how quickly does it repond to client queries?
- Is the buffer cache utilized optimally, or are requests for heap blocks and index blocks being increasingly serviced by direct disk accesses?
- Is any tablespace running low on free space? If so, which one?
- How well does the background writer perform checkpointing? Is too much I/O load being imposed by the writer in the process of checkpointing?
- Are too many rollbacks occurring on any database? If so, which one?
- Are indexes used effectively?
- Are there any useless/unused indexes on the server? Which ones are these?
- Have too many sequential scans occurred on any table?
- Are inserts, updates, and deletes happening too slowly on any table?
- Is any table experiencing extreme or major issues while querying data from the server?
- Does any user have too many idle connections on the server?
- Is any user’s connection waiting for a locked resource to be released?
- Are too many locks being currently held on the server? Which lock mode is the maximum?
- Are any queries running for too long a time on the server? If so, which ones are these?
The sections that follow will deal with the top four layers of Figure 1 as the other layers have already been dealt with in the Monitoring Unix and Windows servers document.