Monitoring Redis
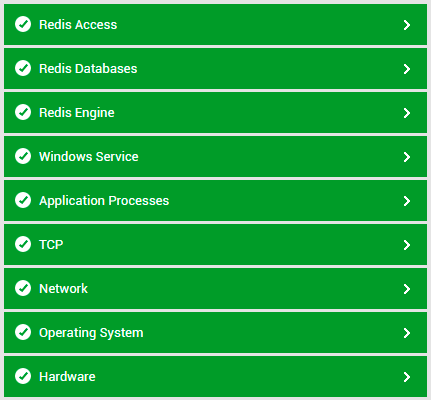
As mentioned earlier, eG Enterprise provides a specialized model for monitoring Redis (see Figure 9).

Figure 9 : Layer model of Redis
Each layer of Figure 9 above is mapped to tests that report a variety of metrics revealing the availability, request/command processing ability, replication and clustering performance, client connections, and much more!
Using these metrics, administrators can find quick and accurate answers to the following persistent performance queries:
-
Is the Redis server available over the network?
-
Is the server responding to a ping request with a pong?
-
Did the server reboot recently? If so, was it a scheduled or unscheduled reboot?
-
Is any client connection to Redis been idle for too long a time? If so, what is that client's IP address?
-
Which are the long running client connections to the Redis server?
-
Did the server reject any connections to it because the maxclients limit was reached?
-
Is there enough space in the Redis query buffer? Which client's query buffer is running out space?
-
Is the output list of any client very long? If so, which client has a long output list? Is the abnormal output list length because of lack of memory in the output buffer of that client?
-
Is the Redis server consuming CPU excessively? If so, what is contributing to this erratic CPU usage - resource-intensive system processes? or resource-hungry user processes?
-
Is the server about to exhaust its maxmemory limit?
-
Has high memory fragmentation been noticed on the server?
-
Is the server overloaded with commands to be processed?
-
Has any command been CPU-intensive consistently?
-
Has the Slowlog captured any slow commands? If so, which are these commands and when were they executed?
-
Are keys in any Redis database expiring soon? If so, which database do these keys belong to?
-
Have many keys expired?
-
Have any keys been evicted?
-
Is the keyspace able to service all requests to it, or are too many keyspace hits going unserviced? Is the poor hit ratio increasing server latency?
-
Did the last RDB save operation take too long to complete?
-
Has it been long since the last successful RDB save operation occurred?
-
Is Append Only File (AOF) logging enabled on the server?
-
Is the target Redis server the master or slave in a replication configuration?
-
If the target is a slave, then is it able to connect to the master? Has the link to the master been down too long?
-
Is the slave syncing with the master very slowly?
-
Is the replication backlog rightly sized?
-
Are more full synchronizations occurring than partial synchronizations?
-
Have any partial synchronization attempts failed?
-
Is the monitored Redis instance part of a cluster? If so, is the cluster operating normally at present?
-
Are any hash slots in the cluster in the FAIL or PFAIL state?
-
Were any nodes recently added to or deleted from the cluster? If so, which nodes are these?