Monitoring Microsoft SharePoint Online
To monitor the managed Microsoft SharePoint Online component, login to the eG management console as a user with monitoring privileges.
Browse the Components At-A-Glance section of the Monitor Home page that appears, and locate the Microsoft SharePoint Online component type. Click on the bar that corresponds to this component type. This will lead you to the Layers tab page, where you can view the monitoring model for Microsoft SharePoint Online (see Figure 5).
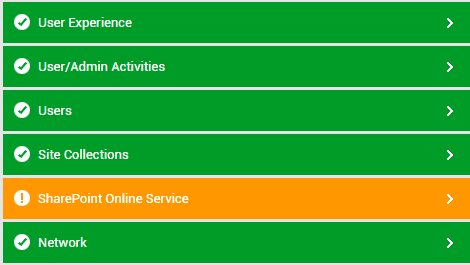
Figure 5 : Layer model for the Microsoft SharePoint Online component
Each layer of Figure 5 is mapped to tests that report metrics, which help audit a wide variety of operations performed on SharePoint Online (eg., file operations, folder operations, site administration operations, etc.), and also help manage the health of sites and site collections. Using these metrics, administrators can find quick and accurate answers to the following performance queries:
- Is SharePoint Online accessible over the network?
- Has any latency been noticed in network connections to SharePoint Online?
- Is any SharePoint site unavailable? If so, which site is it?
- Is any SharePoint site taking too long to respond to requests?
- Were any sites deleted recently? Which ones are they?
- Are there any inactive site collections? If so, which ones?
- Which site collection is locked?
- Is any site collection accessed by external users?
- Is any site collection running out of server and/or storage resources? If so, why? - is it because the resource usage quotas for the site collection has been poorly set? Or is it because the tenant's resource usage quota has not been properly set?
- What type of operations are performed on SharePoint Online - file and page operations? folder operations? sharing and access operations? site administration operations? synchronization operations? or all of the above?
- Are file and page operations imposing too much load on SharePoint Online? If so, what type of operations are contributing to this load? Who initiated such operations, from where? Is anything suspicious about these operations?
- Are folder operations imposing too much load on SharePoint Online? If so, what type of folder operations are contributing to this load? Who initiated such operations, from where? Is anything suspicious about these operations?
- Are too many sharing and access activities been performed on SharePoint Online? If so, what type of operations are contributing to this load? Who initiated such operations, from where? Is anything suspicious about these operations?
- Are any synchronization operations in progress currently? If so, who initiated such operations and from where?
- Were any sync relationships not allowed?
- Are an abnormally large number of synchronization operations been performed? If so, what type of synchronization operations are contributing to this unusual workload, and who is initiating such operations? Are all such operations performed only by authorized users?
- Did any file operation - checkin, checkout, download, upload, or deletion - fail?
- Did any file operation - checkin, checkout, download, upload, or deletion - take too long a time?
- Is the health score of SharePoint abnormal?
- Did any health check fail? If so, which health check failed on which site collection?
For more information on the Network layer, refer to the Monitoring Unix and Windows Servers document. This
The SharePoint Online Service Layer