Monitoring Sybase ASE (Below v15) Server Using the Monitor Client Library
In order to extract performance data from a Sybase ASE (Below v15) server using the Monitor Client Library, eG Enterprise provides the Sybase ASE (Below v15) monitoring model (see Figure 1).
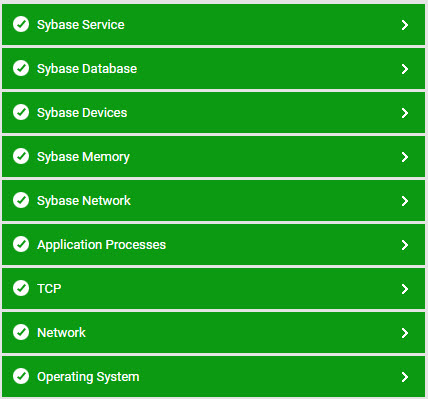
Figure 1 : Layer model for Sybase ASE (Below v15) server
Every layer of Figure 1 is associated with a series of tests, which when executed on the Sybase ASE (Below v15) server, extract a wealth of performance metrics from the server. These statistics in turn enable administrators to quickly figure out the following:
- Is the Sybase server available? If so, does it respond to requests quickly?
- Is the Sybase ASE (Below v15) server overloaded?
- Is the I/O activity on the server optimal?
- How many locks are currently active on the database? Have the locks been held for an unusually long time? Do applications have to wait for too long to acquire a lock?
- Are there too many deadlocks on the database?
- Are the Sybase data and procedure caches been effectively utilized?
- Is sufficient space available for all Sybase databases? Should more space be allocated to any specific database?
- Are transactions rolled back frequently?
- Are there too many root blocker processes on the database?
- Which is the busiest program/application executing on the Sybase database in terms of number of open connections to it? Is any application consuming the CPU resources excessively?
The sections to come discuss each of the top 5 layers of Figure 1 elaborately, as the remaining layers have been dealt with in the Monitoring Unix and Windows Servers document.