History of Acknowledgements
In large environments, it is but natural that the same set of components are assigned to multiple users for monitoring. In such environments, alarm acknowledgement rights would be granted to all these users. To acknowledge an alarm, these users post their acknowledgement description comments against that alarm. Whenever large volumes of alarms are generated by the eG Enterprise in that environment and acknowledged by the users, administrators found it difficult to figure out the exact time at which each alarm was acknowledged and how long did it take to acknowledge a generated alarm. To cater to the needs of administrators who would generally want to figure out how many alarms in the environment were acknowledged and how many are yet to acknowledged and how long it took to resolve an issue, eG Enterprise provides a specialized History of Acknowledgements report!
To generate this report, do the following:
- Select the History of Acknowledgements option from the Operational Reports node of the REPORTS BY FUNCTION tree.
-
Figure 1 then appears.
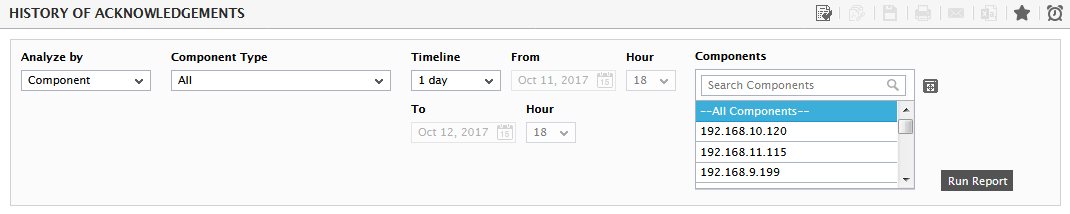
Figure 1 : Generating the History of Acknowledgements report
-
You can build filter conditions using Figure 1 so that, you can selectively view the acknowledgment history. The first step towards building these filter conditions is selecting a basis for the filter. This can be achieved by picking an option from the Analyze by list. The options available here are as follows:
- Component : This is the default selection in the Analyze by list. This implies that by default, the history of acknowledgments report is generated for all managed components in the environment. If you proceed with the default selection, then, you will find that All is the default selection in the Component Type list, and all the managed components in the environment populate the Components list. If you want to view the alarm history of a particular component of a particular component-type, pick the type of your choice from the Component Type list; this will make sure that the Components list consists of only those managed components that are of the chosen type. You can then easily pick the component of your choice from the Component list.
-
Zone: Selecting this option from the Analyze by list will invoke a Zone list. Select a particular zone from this list, if you want to view the history of acknowledgments related to that zone. An Include Subzones flag also appears. By setting this flag to Yes, you can make sure that the acknowledgement history also includes those alarms that are associated with the sub-zones of the chosen zone.
Once a Zone is selected, the Component Type and Components lists will be populated with those component types and components (respectively) that are part of the selected zone. To view the alarm history of a component that is part of a zone, pick that component from the Components list. If the Componentslist has too many components to choose from, then, you can condense the list by first picking a Component Type; this will make sure that the Components list consists of those components in the selected zone that are of the chosen type. You can then easily pick the component of your choice from the Components list.
Note that the 'Zone' option will not be available in the 'Analyze by' list if no zones are configured in the environment.
-
Segment: If this option is chosen from the Analyze by list, a Segment list will additionally appear. In order to view the acknowledgement history pertaining to a specific segment, pick a segment from the Segment list.
Once a Segment is selected, the Component Type and Components lists will be populated with those types and components (respectively) that are part of the selected segment. To view the acknowledgement history of a component that is part of a segment, pick that component from the Components list. If the Components list has too many components to choose from, then, you can condense the list by first picking a Component Type; this will make sure that the Components list consists of those components in the selected segment that are of the chosen type. You can then easily pick the component of your choice from the Components list.
Note that the 'Segment' option will not be available in the 'Analyze By' list if no segments are configured in the environment.
-
Service: If this option is chosen from the Analyze by list, a Service list will additionally appear. In order to view the acknowledgment history pertaining to a specific service, pick a service from the Service list.
Once you choose a Service, the Component Type and Components lists in Figure 1 will be populated with those types and components (respectively) that are engaged in the delivery of the said service. If you want to view the acknowledgment history of a component that supports the selected service offering, pick that component from the Components list. If the Components list has too many components to choose from, then, you can condense the list by first picking a Component Type; this will make sure that the Components list consists of those components in the selected service that are of the chosen type. You can then easily pick the component of your choice from the Components list.
Note that the 'Service' option will not be available in the 'Analyze by' list if no services are configured in the environment.
- If the Components list consists of too many components, then viewing all the components and selecting the ones you need for report generation could require endless scrolling. To avoid this, you can click the
 button next to the Components list. The COMPONENTS pop up window will then appear using which you can view almost all the components in a single interface and Select the ones for which the report is to be generated.
 - For viewing the details of alarms and the acknowledgments that were generated during a specific time window, select a fixed Timeline, or choose Any to provide a date/time range.
-
In addition to the settings discussed above, this report comes with a set of default specifications. These settings are hidden by default. If you do not want to disturb these default settings, then you can proceed to generate the report by clicking the Run Report button soon after you pick one/more components from the Components list. However, if you want to view and then alter these settings (if required), click on the
 button. The default settings will then appear in the MORE OPTIONS drop down window (see Figure 2). The steps below discuss each of these settings and how they can be customized.
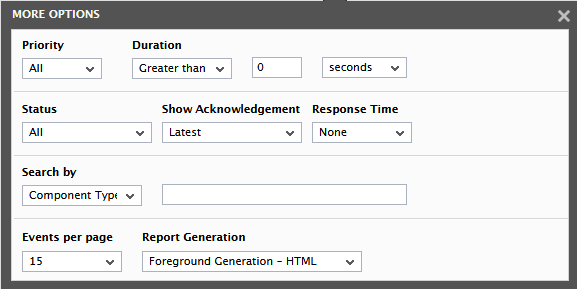
Figure 2 : The default settings for generating the History of Alarms report
- You can even choose to view the details of past alarms that are of a particular priority, by selecting that priority from the Priority list. All is the default selection here.
- If you wish to view the alarms assigned to a chosen user in your environment, then select the user from the User(s) list. By default, All option will be chosen from this list indicating that the alarms pertaining to all the users will be listed by default. The User(s) list will appear only when you set the Show_Users flag to true under the [ALARM_HISTORY] section in the eg_ui.ini file that is available in the <eG_INSTALL_DIR>\manager\config\default folder. By default, the Show_Users flag is set to false.
- Next, to view the acknowledgments that have remained unresolved for a time period that is in excess of a specified duration, select the Greater than option from the Duration list, enter a value in the adjacent text box, and then select a unit of time from the list box alongside. For example, to view the history of the acknowledgments that have remained unresolved for over 1 hour, select the Greater than option, enter 1 in the text box alongside, and select hours from the list box adjacent to it.
- Similarly, you can view the history of acknowledgments that have remained unresolved for a time period lesser than a specified duration. To achieve this, select the Lesser than option from the Duration list, specify a value in the adjacent text box, and select a unit of time from the list box.
- Select a criteria based on which the report should be generated from the Status text box. For example, if you wish to generate the report for all the unacknowledged alarms in your environment, then choose Unacknowledged from this list.
- By default, the Latest option is chosen from the Show Acknowledgment list indicating that the last acknowledgment status of the alarms alone will be considered while generating the alarm. If you wish to view all the acknowledgments made to the alarms, then choose the All option from this list.
- If you wish to generate the report based on the alarms being responded (i.e., acknowledged/unacknowledged) within a stipulated time, then you can pick a Response Time of either Greater than or Lesser than option, specify a value in the adjacent text box, and select a unit of time from the list box. By default, None will be chosen from the Response Time list.
- To search for the alarms pertaining to a chosen Component Type, Component, Service or test, you can use the Search by drop down list and provide the name of the Component Type, component, service or test of your choice in the text box adjacent to the list. In addition, if you wish to filter out the alarms with the key words of your choice, then you can choose the Description option from the Search by list and type in the keywords that you are looking for in the alarms. For example, if you wish to filter out the alarms pertaining to High CPU usage, then you can select Description from the Search by list and type CPU as the keyword in the text box adjacent to the drop-down list.
- In addition, you can configure the number of event records to be displayed per page of the event history. By default, 15 records are displayed per page. To display more records, select an appropriate value from the Events per page list.
-
In large environments, reports generated using months of data can take a long time to complete. Administrators now have the option of generating reports on-line or in the background. When a report is scheduled for background generation, administrators can proceed with their other monitoring, diagnosis, and reporting tasks, while the eG manager is processing the report. This saves the administrator valuable time. To schedule background processing of a report, you can either select the Background Save - PDF option or the Background Save - CSV option from the Report Generation list. In this case, a Report Name text box will appear, where you would have to provide the name with which the report is to be saved in the background. To process reports in the foreground, select the Foreground Generation - HTML option from this list.
Note:
- The Report Generation list will appear only if the EnableBackgroundReport flag in the [BACKGROUND_PROCESS] section of the eg_report.ini file (in the [EG_INSTALL_DIR]\manager\config directory) is set to Yes.
- The default selection in the Report Generation list will change according to the Timeline specified for the report. If the Timeline set is greater than or equal to the number of days specified against the MinDurationForReport parameter in the [BACKGROUND_PROCESS] section of the eg_report.ini file, then the default selection in the Report Generation list will be Background Save - PDF. On the other hand, if the Timeline set for the report is lesser than the value of the MinDurationForReport parameter, then the default selection in the Report Generation list will be Foreground. This is because, the MinDurationForReport setting governs when reports are to be processed in the background. By default, this parameter is set to 2 weeks - this indicates that by default, reports with a timeline of 2 weeks and above will be processed in the background.
-
Finally, click the Run Report button to generate the report. Figure 3 then appears.
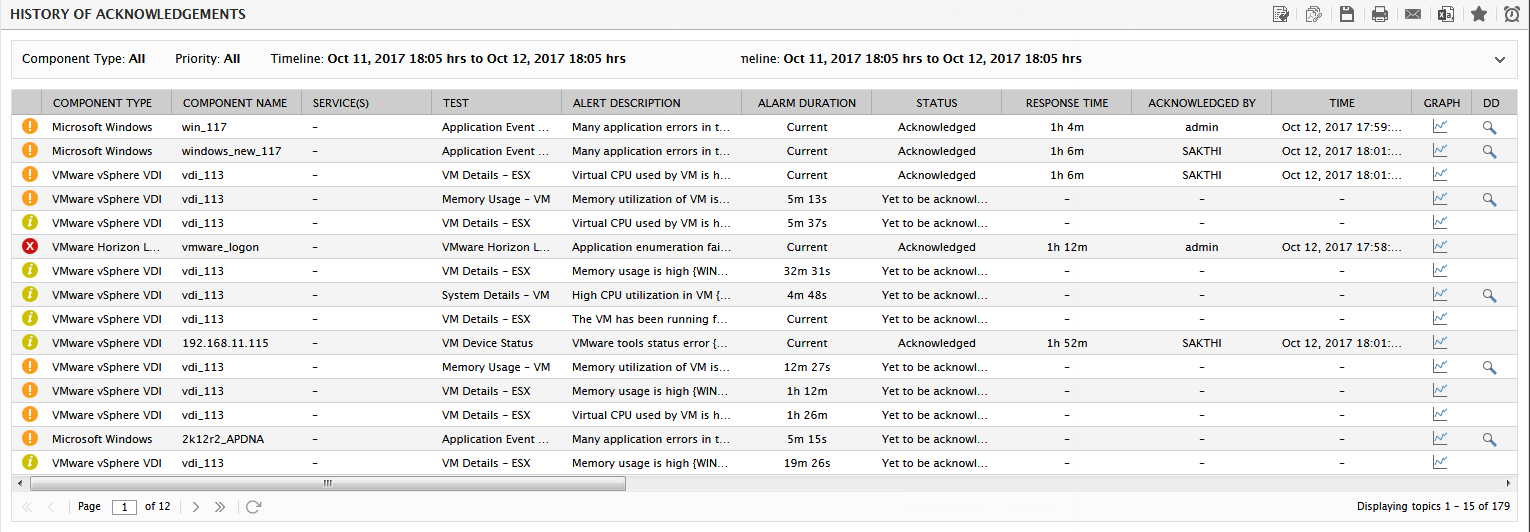
- In this report, the details pertaining to every alarm like the name of the component, component-type, test, alarm description, the duration of the alarm, the status of the alarm (whether acknowledged/unacknowledged), the user responsible for the alarm, the response time for the alarm and the service (if any) that is impacted by the issue, are available. Every row of alarm information will be accompanied by a colored indicator that indicates the corresponding alarm priority. Critical alarms will be of the color red, major alarms will be in orange, and the minor ones come in yellow. An alarm with the end time set to current denotes a problem that has still not been fixed.
- The HISTORY OF ACKNOWLEDGEMENTS report also comprises of the
 icon, which when clicked, allows you to view the graph of the corresponding measure for the last one hour. If the detailed diagnosis capability has been enabled for the eG installation, then problem measures for which detailed diagnosis is available will be accompanied by the
  icon. When this icon is clicked, the detailed diagnosis of the measure will appear, throwing greater light on the problem condition.
 - The NEXT, PREVIOUS, LAST and FIRST buttons, and the Page text box are provided to enable you to easily browse the alarm information that runs across pages.