Monitoring Aggregate Components
eG Enterprise typically monitors every component of a type, separately. However, sometimes, administrators might want to receive an aggregated view of the performance of two/more components of a type. For instance, Citrix administrators might want to know the total number of users who are currently logged into all the Citrix servers in a farm, so that sudden spikes in the load on the farm (as a whole) can be accurately detected. Similarly, Windows administrators might want to figure out the average CPU usage across all the Windows servers in an environment, so that they can better plan the capacity of their Windows load-balancing clusters.
To provide such a consolidated view, eG Enterprise embeds a license-controlled Metric Aggregation capability. This feature, when enabled, allows administrators to group one or more components of a particular type and monitor the group as a single logical component, broadly termed as an aggregate component. The eG Enterprise system then automatically aggregates the metrics reported by the components in the group by applying pre-configured aggregate functions on them, and reports these metrics as if they were extracted from the managed aggregate component. Separate thresholds need to be set for the aggregated metrics to track deviations in the consolidated performance. The state of the aggregate component is governed by these exclusive thresholds, and not by the state of the components within the group.
The egsm user of the eG SuperManager can monitor all the aggregate components that are managed by the individual eG managers that are reporting to the SuperManager.
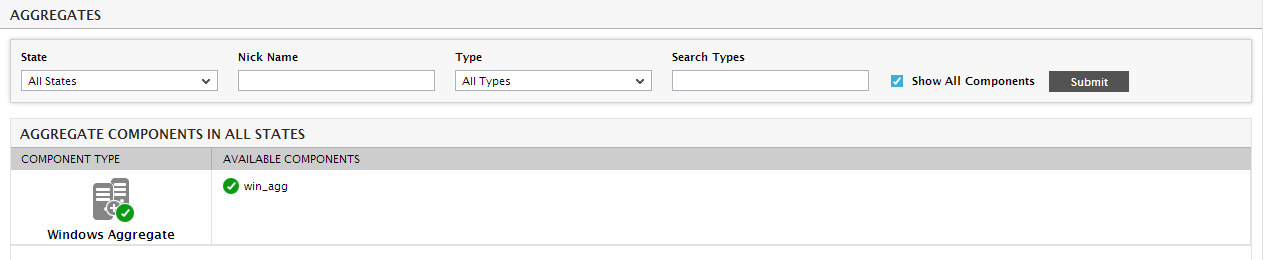
Figure 1 : The AGGREGATES page in the eG SuperManager
To know more about monitoring the aggregate components in the overall infrastructure, refer to