Monitoring Aggregate Components
eG Enterprise typically monitors every component of a type, separately. However, sometimes, administrators might want to receive an aggregated view of the performance of two/more components of a type. For instance, Citrix administrators might want to know the total number of users who are currently logged into all the Citrix servers in a farm, so that sudden spikes in the load on the farm (as a whole) can be accurately detected. Similarly, Windows administrators might want to figure out the average CPU usage across all the Windows servers in an environment, so that they can better plan the capacity of their Windows load-balancing clusters.
To provide such a consolidated view, eG Enterprise embeds a license-controlled Metric Aggregation capability. This feature, when enabled, allows administrators to group one or more components of a particular type and monitor the group as a single logical component, broadly termed as an aggregate component. The eG Enterprise system then automatically aggregates the metrics reported by the components in the group by applying pre-configured aggregate functions on them, and reports these metrics as if they were extracted from the managed aggregate component. Separate thresholds need to be set for the aggregated metrics to track deviations in the consolidated performance. The state of the aggregate component is governed by these exclusive thresholds, and not by the state of the components within the group.
If remote agents are used to perform metric aggregation, one/more premium monitor licenses would be required for implementing this capability. However, if an external agent is used to perform metric aggregation, no license is required for implementing this capability.
Using this Metric Aggregation capability, administrators can perform the following:
- Effectively assess the collective performance of a group of components of a particular type
- Easily study load and usage trends of server farms (or groups) as a whole
- Accurately detect resource inadequacies or unusual load conditions in the component group or farm
- Compare and correlate the performance of the member components with that of the aggregate component, so that the reasons for performance issues with the aggregate component can be precisely determined;
If one/more aggregate components have been managed in your environment, then the Aggregates doughnut graph in the Infrastructure Health section of the Monitor Home Page will indicate the number of aggregate components that are being monitored and their current state (see Figure 1).
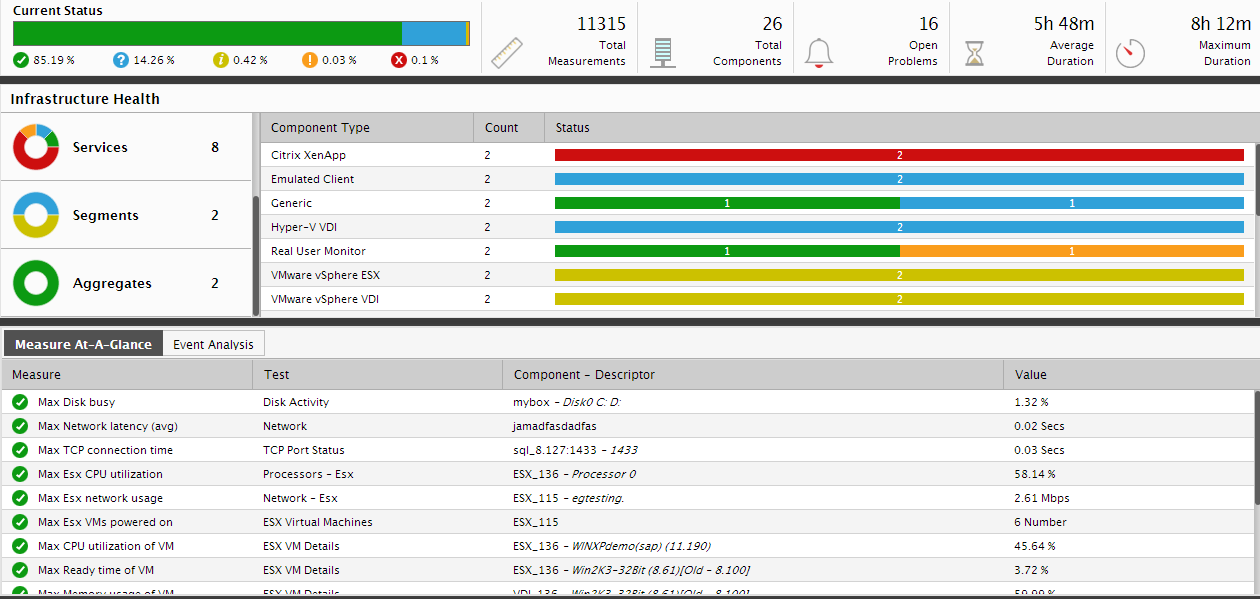
Figure 1 : The Aggregates doughnut graph in the Infrastructure Health section
Each division of the Aggregates doughnut graph will indicate the current state of the managed aggregate components and the number of aggregate components in each state.
Clicking on a division in the Aggregates doughnut graph will lead you to the component aggregates page. This page lists the aggregate types that have been managed and the names of aggregate components of each type that are currently in the state represented by the division that was clicked on (see Figure 1).
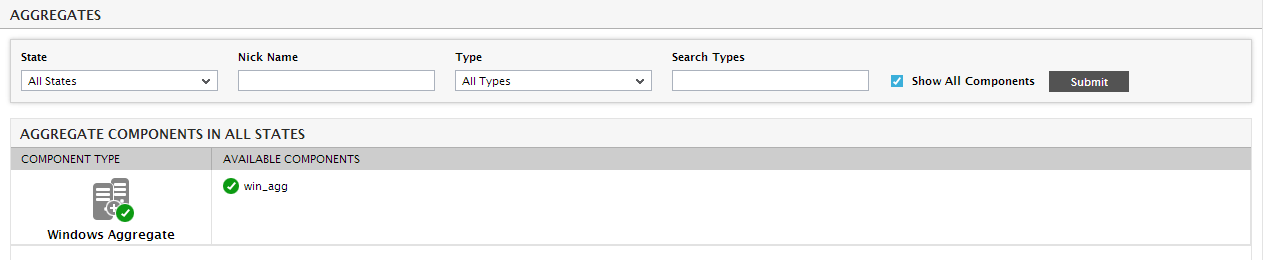
Figure 2 : The COMPONENT AGGREGATES page
To zoom into the layer model of an aggregate component, click on that component in the component aggregates page. The Layer tab page will then open displaying the layer model of the aggregate component (see Figure 2).
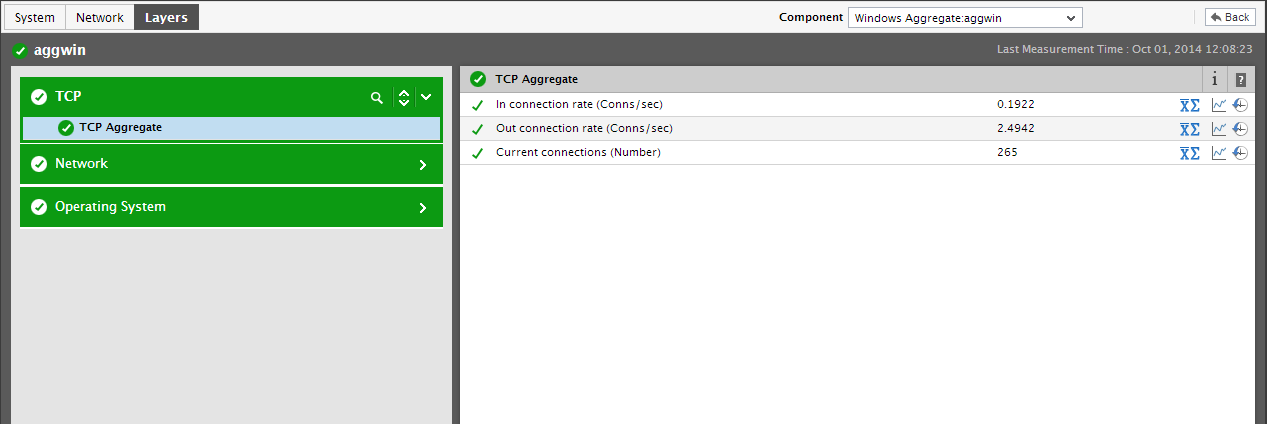
Figure 3 : Layer model of an aggregate component
Like individual components, aggregate components too are represented in the eG monitoring console using a hierarchical set of layers. Typically, an aggregate component will be represented using the same set of layers that are associated with the corresponding non-aggregate component. For instance, the Citrix XenApp Aggregate component will support the same layer model as the Citrix Xenapp component.
Each layer of an aggregate component will be mapped to a set of aggregate tests. Some layers will be associated with precanned aggregate tests. Besides these default tests, administrators can also add new aggregate tests and associate them with the aggregate components. To know how to add/configure aggregate tests, refer to Chapter 3 of this document.
While clicking on a layer will list all the aggregate Tests mapped to that layer, clicking on a test will open a Measurements panel where all the aggregated metrics collected by that test will be displayed (see Figure 3).
To perform metrics aggregation, the eG Enterprise system applies certain aggregate functions on the measures collected from across all the components of a type that are grouped under a particular aggregate component. In case of precanned aggregate tests, these functions are also hard-coded into the eG Enterprise system. In case of a user-configured aggregate test however, the users can indicate what function should be applied on each measure reported by that test. The Measurements panel of the Layer tab page not only displays the names of the aggregated measures and their aggregated values, but also indicates what function has been applied on the measure to perform aggregation. Statistical symbols have been used to represent functions. These symbols and the functions they represent have been discussed in the table below:
|
Symbol |
Function |
|---|---|
|
|
Sum |
|
|
Max |
|
|
Min |
|
|
Average |
|
|
Avg-Sum |


Move your mouse pointer over a symbol in the Measurements panel to know what function it represents. Clicking on the symbol that corresponds to a measure in the Measurements panel will open Figure 3, using which you can understand how the value of that measure was computed. The Component Name column in Figure 3 lists all the individual components that have been grouped under the aggregate component in question. Against every Component Name, the Aggregated Measure value of that component will be displayed. For instance, for a measure on which the Avg-Sum function has been applied, the Aggregated Measure column will display the average value of that measure for the displayed Component Name during the last test frequency. The sum of the average values of all Component Names will be displayed as the value of the measure in the Measurements panel.
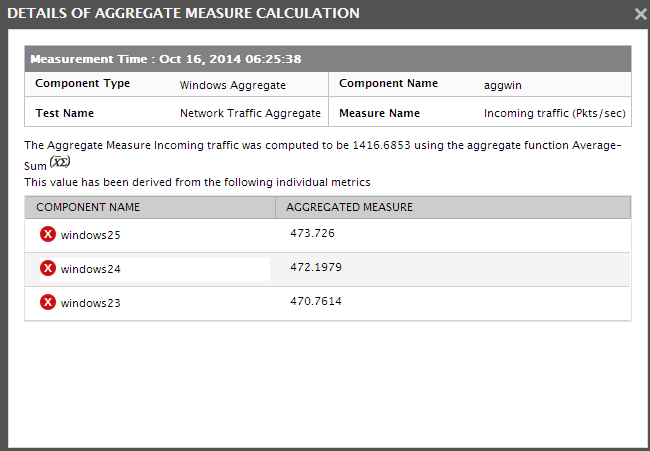
Figure 4 : How the aggregate measure was calculated?
Likewise, clicking on the details button in the Measurements panel will list all the member components that have been included as part of the aggregate component (see Figure 3).
Clicking on the Graph icon corresponding to an aggregate measure will reveal a Measure Graph that plots the time-of-day variations in the aggregated metrics during the last hour (by default) (see Figure 5).
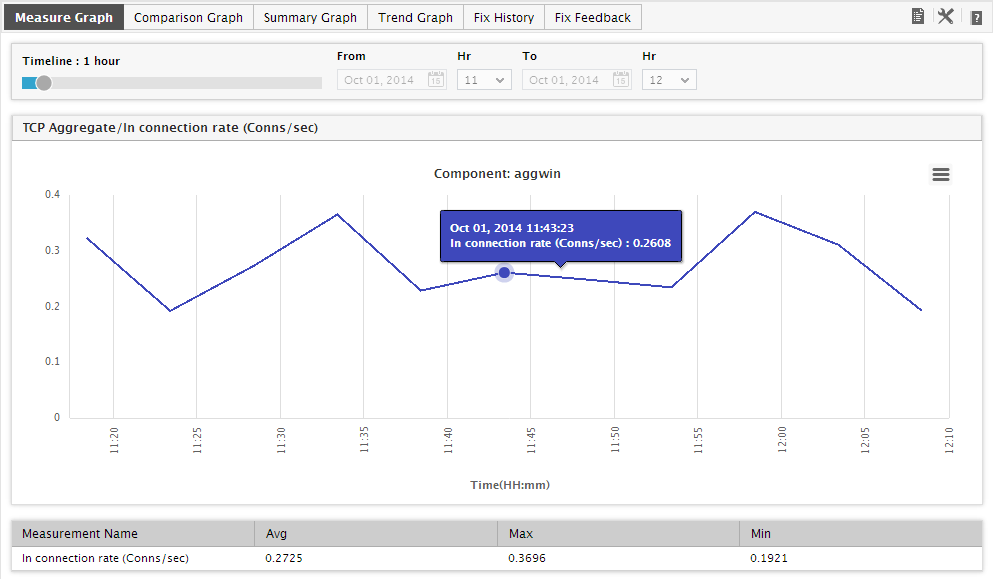
Figure 5 : Viewing a graph of an aggregate measure
A Comparison Graph will also be additionally available for an aggregated measure. To view this graph, you will have to click on the Comparison Graph tab page next to the Measure Graph tab page (see Figure 5). Using this graph, you can compare the historical measures of the target aggregate component with that of each of its member components for a given timeline. If the aggregate measure reports a deviation, then this graph will enable you to isolate the member component that could have caused the deviation. For instance, say that you have managed a Citrix XenApp Aggregate component, which is associated with all the Citrix XenApp servers in your Citrix farm. Assume that you have configured this aggregate component to alert you if more than 100 sessions are active on your farm. If this anomaly occurs – i.e., if the number of sessions to the Citrix farm exceeds 100 – then the Citrix XenApp Aggregate component will naturally trigger an alert. At this juncture, you can use the Comparison Graph to figure out the following:
- Whether this increase in session count was sudden or consistent;
- Whether it is because of a sudden/consistent growth in the number of sessions to a particular Citrix server in the farm; if so, you can even use this graph to point to the problem server.
- Whether it is because the number of sessions to all the servers in the farm has increased over time;
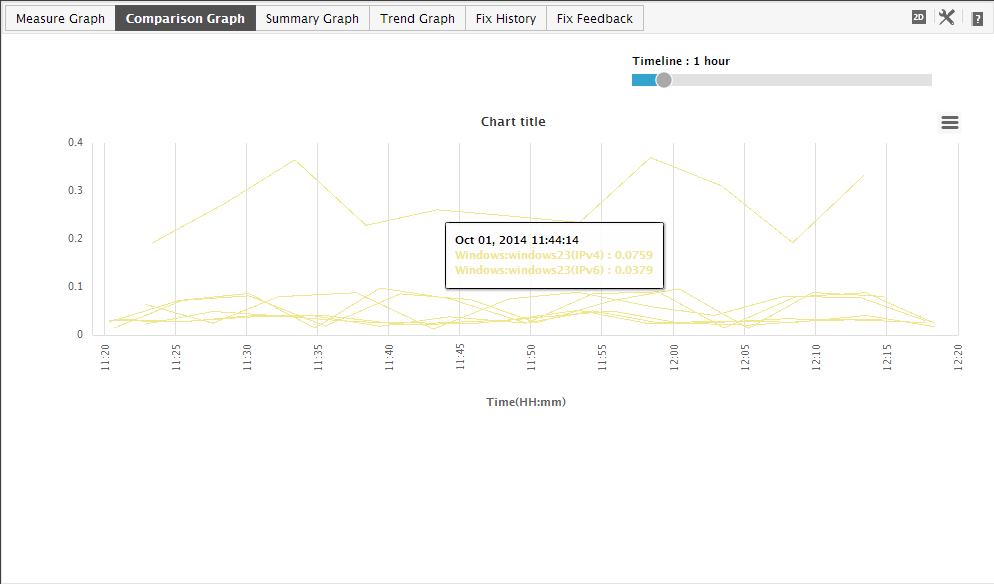
Figure 6 : The Comparison Graph of an aggregate measure
Moreover, in Figure 6, you can see that there is a time lag in the aggregate graph line. This is because, aggregate measures are computed one measurement period before the individual components. This is done to ensure that all measures are considered when aggregating metrics.