Monitoring Tibero Database Server

Figure 1 depicts the layer model that the eG Enterprise uses to monitor an Tibero Database server.

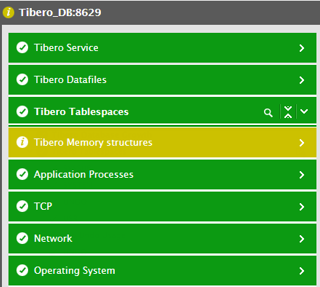
Figure 1 : Layer model for the Tibero Database Server

Each of the layers in Figure 1 above is mapped to a wide variety of tests, which collect a wealth of performance data from the Tibero Database Server. Using this data, the following questions can be answered:

Database service monitoring

  • Is the database server available for servicing requests and what is the response time for a typical request?

Transaction monitoring

  • What is the commit and rollback behavior of the applications using the database?

Rollback segment monitoring

  • Is there heavy contention for the rollback segments?

Lock and latch monitoring

  • Is there contention for locks? Is a specific application holding a lock for a long time? Which lock(s) are these?

Full table scan monitoring

  • Is there any full table scan happening on the database? If so, how frequently?

Tablespace monitoring

  • Are any of the tablespaces reaching their storage capacity? Is the load adequately balanced across the tablespaces?

Hot file monitoring

  • Is the disk I/O (read/write) being balanced across the datafiles or is there a particular hot datafile that is handling all the requests?