Process Scheduler Test
In large environments, administrators schedule a few processes for e.g., backup jobs, maintenance tasks etc, for execution only during specific hours. If those processes fail to run as scheduled or take longer than the scheduled run time, administrators should initiate troubleshooting on the system to maintain the reliability and optimal performance of the system. In environments where hundreds of processes are scheduled for execution only during specified time, administrators found it difficult to identify such processes that were running/not running during the scheduled time duration. To capture such processes and take appropriate action, administrators can use the Process Scheduler test.
This test enables administrators to schedule acceptable up and down hours for the processes and reports the CPU utilization and current status of each process that is configured with up/down hours.
Target of the test : Any host
Agent deploying the test : An internal agent
Outputs of the test : One set of results for each process that is scheduled with up and/or down hours on the target host.
|
Parameter |
Description |
|
Test period |
How often should the test be executed |
|
Host |
The host for which the test is to be configured. |
|
Port |
The port number at which the specified host listens to. |
|
Define Process/Schedule |
Defining a schedule for a process enables administrators to track whether the process is running/not running on the target host at specified time duration. For this purpose, administrators can click on the |
|
Wide |
This parameter is valid on Solaris, Windows, and Linux systems only. On Solaris systems (before v11), if the value of the Wide parameter is Yes, the eG agent will use usr/ucb/ps instead of /usr/bin/ps to search for processes executing on the host. In Solaris 11, the eG agent uses the /usr/bin/ps auxwww command to perform the process search. The /usr/ucb/ps and the /usr/bin/ps auxwww commands provide a long output (> 80 characters), whereas /usr/bin/ps only outputs the first 80 characters of the process path and its arguments. However, some Solaris systems are configured with tightened security, which prevents the usr/ucb/ps and/or the /usr/bin/ps auxwwwcommand to be executed by any and every user to the system - in other words, only pre-designated users will be allowed to execute this command. The sudo (superuser do) utility (see http://www.gratisoft.us/sudo/) can be used to allow designated users to execute this command. If your system uses sudo to restrict access to the commands that return a long output, then set wide to Yes and then specify the value sudo for the keonizedservercmd parameter. This will ensure that not only does the agent use the /usr/ucb/ps and/or the /usr/bin/ps auxwww command (as the case may be) to monitor processes (like it would do if the wide parameter were set to be Yes), but it would also use sudo to execute this command. Note: If this test on Solaris 11 fails, then do the following:
On Windows environments, by default, the eG agent uses perfmon to search for the processes that match the configured patterns. Accordingly, the Wide parameter is set to No by default. Typically, a process definition in Windows includes the full path to the process, the process name, and process arguments (if any). Perfmon however scans the system only for process names that match the configured patterns – in other words, the process path and arguments are ignored by perfmon. This implies that if multiple processes on a Windows host have the same name as specified against processpattern, then perfmon will only be able to report the overall resource usage across all these processes; it will not provide any pointers to the exact process that is eroding the host’s resources. To understand this better, consider the following example. Typically, Windows represents any Java application executing on it as java.exe. Say, two Java applications are executing on a Windows host, but from different locations. If java.exe has been configured for monitoring, then by default, perfmon will report the availability and average resource usage of both the Java applications executing on the host. If say, one Java application goes down, then perfmon will not be able to indicate accurately which of the two Java applications is currently inaccessible. Therefore, to enable administrators to easily differentiate between processes with the same name, and to accurately determine which process is unavailable or resource-hungry, the eG agent should be configured to perform its process searches based on the process path and/or process arguments, and not just on the process name – in other words, the eG agent should be configured not to use perfmon. To achieve this, first, set the Wide parameter to Yes. This will instruct the eG agent to not use perfmon to search for the configured process patterns. Once this is done, then, you can proceed to configure a processpattern that includes the process arguments and/or the process path, in addition to the process name. For instance, if both the Remote Access Connection Manager service and the Terminal Services service on a Windows host, which share the same name – svchost - are to be monitored as two different processes, then your processpattern specification should be as follows: Terminal:C:\WINDOWS\System32\svchost -k DcomLaunch,Remote:C:\WINDOWS\system32\svchost.exe -k netsvcs You can also use wildcard characters, wherever required. For instance, in the above case, your processpattern can also be: Terminal:*svchost -k DcomLaunch,Remote:*svchost.exe -k netsvcs Similarly, to distinctly monitor two processes having the same name, but operating from different locations, your specification can be: JavaC:c:\javaapp\java.exe,JavaD:d:\app\java.exe Note:
|
|
User |
By default, this parameter has a value "none"; this means that the test monitors all processes that match the configured patterns, regardless of the user executing them. If you want the test to monitor the processes for specific users alone, then, on Unix platforms, specify a comma-separated list of users to be monitored in the User text box. For instance: john,elvis,sydney. While monitoring Windows hosts on the other hand, your user configuration should be a comma-separated list of "domain name-user name" pairs, where every pair is expressed in the following format: Domainname\Username. For example, to monitor the processes of user john and elviswho belong to domain mas, your user specification should be: mas\john,mas\elvis. Also, on a Windows host, you will find system processes running on the following user accounts: SYSTEM, LOCAL SERVICE, and NETWORK SERVICE. While configuring these user accounts, make sure the Domainame is always NT AUTHORITY. In this case therefore, your user specification will be: NT AUTHORITY\SYSTEM,NT AUTHORITY\LOCAL SERVICE,NT AUTHORITY\NETWORK SERVICE. If multiple processes are configured for monitoring and multiple users are also configured, then the test will check whether the first process is run by the first user, the second process by the second user, and so on. For instance, if the processes configured are java:java.exe,apache:*httpd* and the users configured are john,elvis, then the test will check whether user john is running the process java, and user elvis is running the process apache. Similarly, if multiple processes are configured, but a single user alone is configured, then the test will check whether the specified user runs each of the configured processes. However, if you want to check whether a single process, say java.exe, is run by multiple users - say, james and jane - then, you have to do the following:
|
|
Ignorecase |
This parameter is applicable to Unix environments alone. By default, this parameter is set to Yes, indicating that the test will monitor the process names/patterns configured against the process parameter in a case-insensitive manner. In other words, the test will report the count and resource usage of all processes that match the configured process name/pattern, even if their cases do not match. For instance, if the process parameter is configured with Apache:*apache*, then the test will monitor the process named apache and the one named APACHE by default. If you, on the other hand, want process monitoring to be performed in a case-sensitive manner, then set this flag to No. |
|
Correct |
Increased uptime and lower mean time to repair are critical to ensuring that IT infrastructures deliver a high quality of service to users. Towards this end, the eG Enterprise embeds an optional auto-correction capability that enables eG agents to automatically correct problems in the environment, as soon as they occur. With this capability, as and when an abnormal situation is detected, an eG agent can initiate corrective actions automatically to resolve the problem. Automatic correction without the need for manual intervention by IT operations staff reduces service downtime and improves operational efficiency. By default, the auto-correction capability is available in the eG Enterprise for the Processes running measure. The eG Enterprise includes a default auto-correction script. When a process that has been configured for monitoring stops, this script automatically executes and starts the process. To enable the auto-correction capability for the Processes test, first, select the TRUE option against the CORRECT parameter in this page (by default, FALSE will be selected here). |
|
IsPassive |
If the value chosen is Yes, then the server under consideration is a passive server in a cluster. No alerts will be generated if the server is not running. Measures will be reported as "Not applicable" by the agent if the server is not up. |
|
Manager Timezone |
In some environments, eG Manager and eG agent may be running in different time zones. In such environments, this parameter enables administrators to explicitly specify the time zone to use while scheduling the process. If this parameter is set to Yes, then the scheduler will run as per the time zone in which the eG manager is operating. However, if the administrators wish to schedule and run the processes in the time zone in which the agent host is operating, then this parameter should be set to No. |
|
Measurement |
Description |
Measurement Unit |
Interpretation |
||||||||
|---|---|---|---|---|---|---|---|---|---|---|---|
|
Processes running |
Indicates the number of instances of a process(es) currently executing on a host. |
Number |
This value indicates if too many or too few processes corresponding to an application are executing on the host. |
||||||||
|
CPU utilization |
Indicates the percentage of CPU used by executing process(es) corresponding to the pattern specified. |
Percent |
A very high value could indicate that processes corresponding to the specified pattern are consuming excessive CPU resources. |
||||||||
|
Memory utilization |
Indicates if for one or more processes corresponding to a specified set of patterns, this value represents the ratio of the resident set size of the processes to the physical memory of the host system, expressed as a percentage. |
Percent |
A sudden increase in memory utilization for a process(es) may be indicative of memory leaks in the application. |
||||||||
|
Status |
Indicates the status of each process. |
|
If the process is running when it is not supposed to or not running when it is supposed it, that is a problem. The numeric values that correspond to the restart states discussed above are listed in the table below:
Note: By default, this measure reports the value Yes or No to indicate whether a JVM has restarted. The graph of this measure however, represents the same using the numeric equivalents – 0 or 1. |
Scheduling Up/Down Hours for the Processes
To schedule up/down hours for a process, eG Enterprise offers an easy-to-use option in the form of a  icon that is provided against the Define Process/Schedule parameter.
To schedule the up/down hours, do the following:
-
Click on the
icon provided against the Define Process/Schedule parameter in the test configuration page (see ).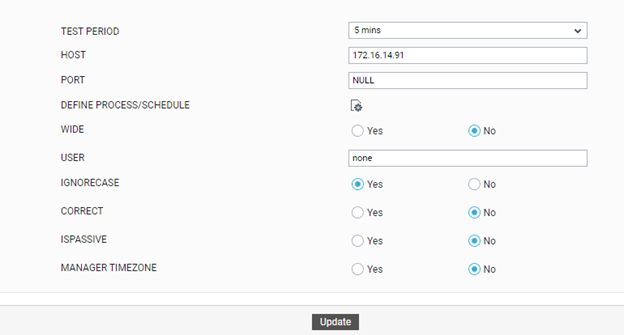
Figure 1 : Configuring the Process Scheduler test
-
When the
icon is clicked, the Process/Schedule configuration window will appear (see ).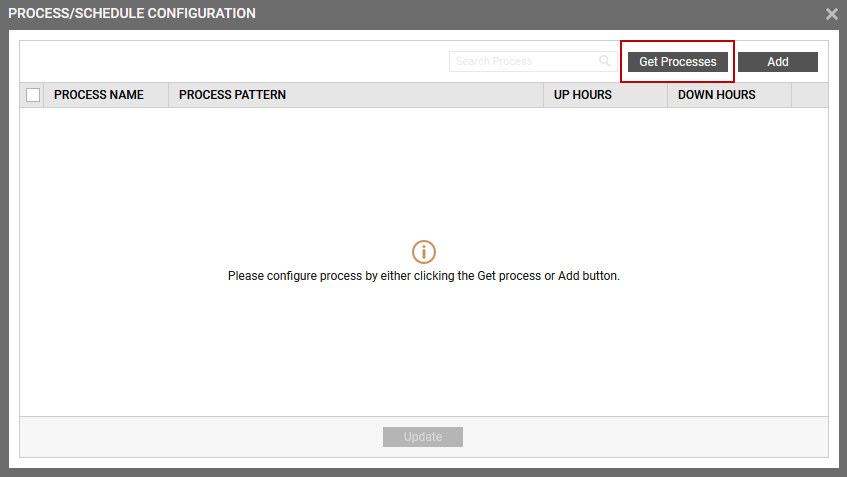
-
In Figure 2, click on the Get processes button to get the processes running on the target host as shown in Figure 3.

-
Next, select the process of your interest from Figure 3 and click the Submit button. The chosen process will be listed in the Process/Schedule configuration window as shown in Figure 4.

-
Upon clicking the
 icon against the process name will invoke Figure 5 that displays the Process name, Process pattern, Up hours and down hours of the chosen process.
Figure 5 : Setting Up and Down hours for the chosen process
Up hours: By default, this value is set to none. Administrators can specify the value by colon separated list of hours, for example - 01:02:03, during which the chosen process should run. This indicates that the process should be running at 01 hrs, 02 hrs and 03 hrs. The administrators can specify one set of up hours for each process pattern.
Down hours: By default, this value is set to none. Administrators can specify the value by colon separated list of hours, for example - 11:12:13, during which the chosen process should not run. This indicates that the process should not be running at 11 hrs, 12 hrs and 13 hrs. The administrators can specify one set of up hours for each process pattern.
Note:
-
Unique values should be specified against the Up Hours and Down Hours fields. Administrators should not specify the values in minutes.
-
None can be specified against the Up Hours and Down Hours fields – in such cases, the processes will be running as such without any schedules.
The administrators can add more processes, process patterns, up hours, and down hours by clicking the Add button. They can also use the Get Processes button to add more processes (see Figure 2) to the list. To delete a process schedule, use the delete icon provided against each schedule.
-