Alarms
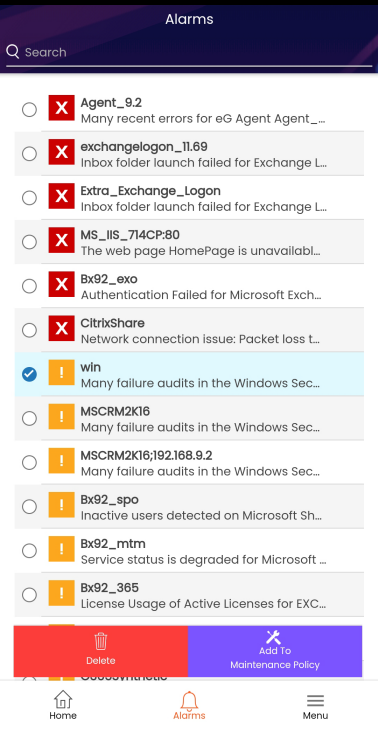
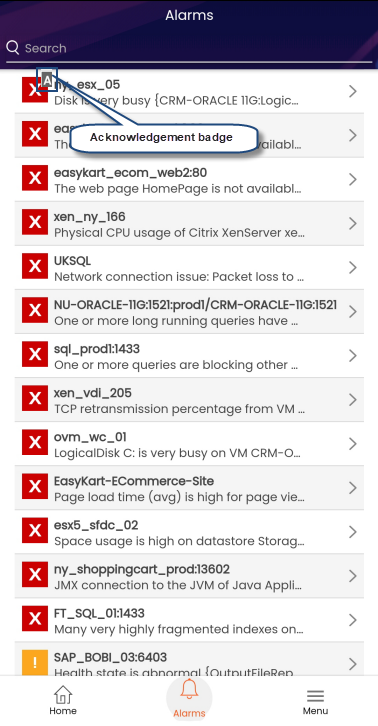
When the Alarm tab is clicked, will appear listing all the currently open alarms in the target environment.
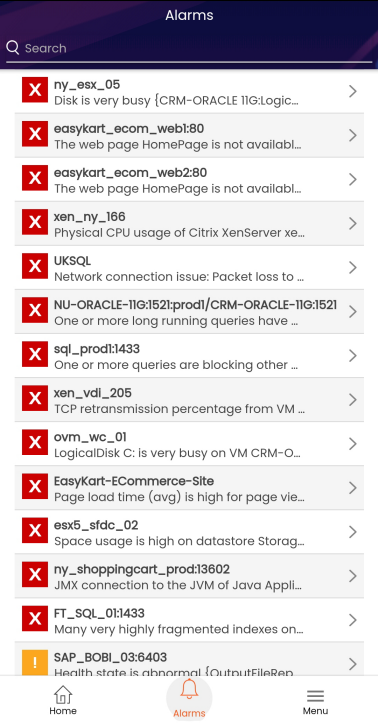
Figure 1 : Alarms screen
Each alarm is accompanied by a colored indicator that represents the alarm priority/severity. The color Red denotes a Critical issue that requires immediate attention. The color Orange indicates a Major issue, and Yellow indicates a Minor problem. The alarms are sorted in the descending order of their priority - starting with the Critical to the Minor.
If your display is crowded by a multitude of alarms, you can use the Search box to locate a particular alarm / alarms of interest to you. For that, just type a part of the problem component name or alarm description in the Search box. Only those alarms that contain the specified Search string in its component name and/or alarm description will then be displayed in the Alarms screen as shown in Figure 2.
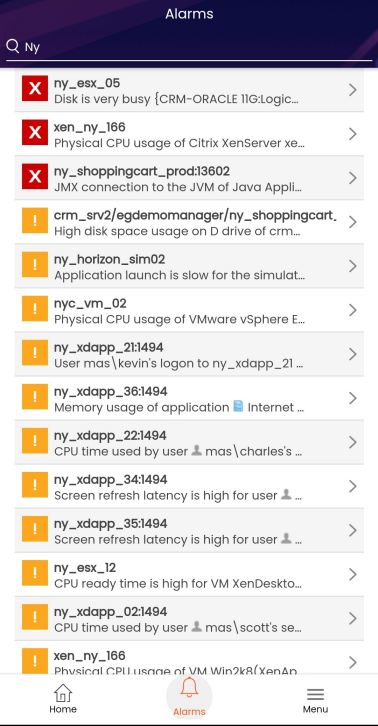
Figure 2 : Searching a particular alarm
Upon clicking on an alarm, you will be redirected to a page showing the Component Type, Component Name, Layer and Start Time as shown in Figure 5.
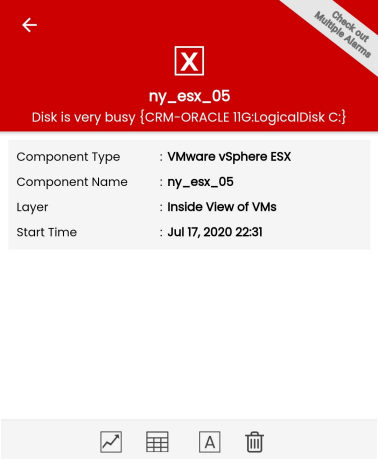
Figure 3 : Alarm description
If multiple alerts have been generated for the same layer, then, details of these alerts are clubbed together. Clicking on the Checkout Multiple Alarms in the top right corner of the page will list the clubbed alerts (see ). Analyzing the listed alerts will help you know more about the exact nature of the problems raised by the alarm.
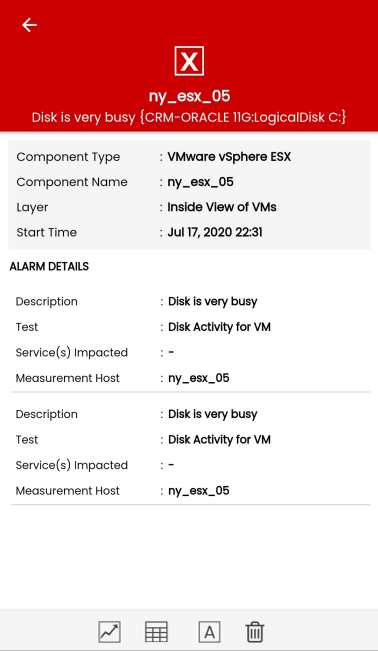
Figure 4 : Clubbed Alarms
For each alarm, additional alarm information includes a brief description of the problem, the test that detected the problem, the services (if any) that has impacted and the name of the host system.

Figure 5 : Viewing alarm details
For instance, reveals a clubbed alarm in which two alerts were clubbed. The alerts were generated due to unexpected increase in Percent virtual disk busy measure of the Disk Activity for VM test.
The alarm details page contains the  icon, which when clicked, allows you to view the graph of the corresponding measure for the last one hour by default. Now, you can view measure graphs for a timeline of up to 1 week. Using the time period drop-down provided in the bottom-left corner of the Graph window (see Figure 6), the graph of alarms that was generated at anytime can be viewed.
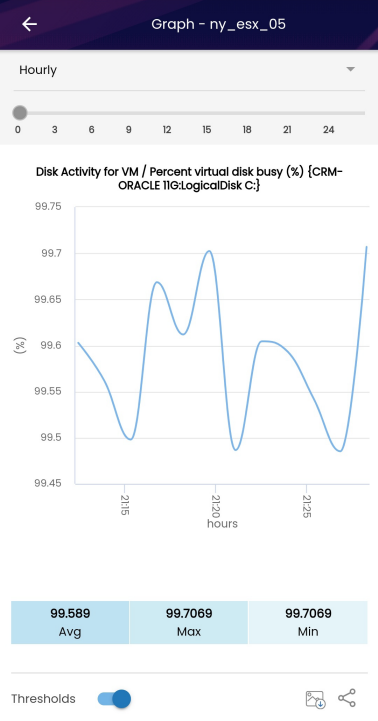
Figure 6 : The graph of the Percent virtual disk busy measure
If you wish to share the graph with others, you can do so by clicking the  icon in the Graph window. When this icon is clicked, the list of sharing applications such as Facebook, WhatsApp, etc., on your mobile device will be displayed. From the list, you can select anyone of the applications of your choice and can share the graph. You can also download and can save the graph as an image using the
  icon.
icon.
Using the Threshold on/off slider in the bottom-right corner of the Graph window, you can view the preset threshold levels on the graph, if any (see Figure 6) . Likewise, you can disable it using the on/off slider when you don't want to see the threshold lines on the graph.
If the detailed diagnosis capability has been enabled for the test, then problem measures for which detailed diagnosis is available will be displayed when the  icon in Figure 5 is clicked. The detailed diagnosis of the measure will appear as shown in Figure 7, throwing greater light on the problem condition. In case of clubbed alarms, the detailed diagnosis of the measure, for which the alert was generated recently, will be displayed by default in the detailed diagnosis screen if available.
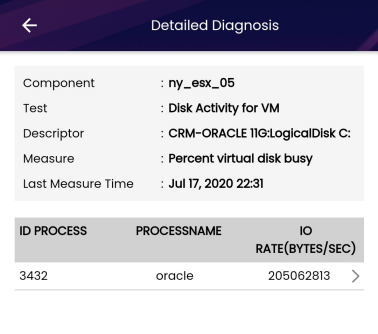
Figure 7 : The detailed diagnosis of the Percent virtual disk busy measure
Clicking the right arrow will display the details such as name and ID of the process, rate at which the IO read and write operations were performed and the rate at which the IO operations performed on the virtual disk.
The alarm details page includes the  icon for acknowledging the alarms. Note that, this icon will appear only if you are logged in as a user with the privilege to acknowledge the alarms. By acknowledging a particular alarm, you can indicate to other users that the issue raised by that alarm is being attended to. To do so, click on the icon and provide the acknowledgment description (if any) in a message box that appears. Then, click the Submit button and give confirmation to save the acknowledgment. Now, the acknowledged alarm will be accompanied by an acknowledgment badge as shown in the Figure 8.
To delete an alarm, just click on the  icon in the drop-down. A message box will then appear requesting you to specify comments, if any, and then confirmation to delete the alarm. Click the OK button in the message box to confirm deletion. Otherwise, click on the Cancel button. Note that the icon will appear only if you are logged in as a user with a privilege to delete the alarms.
Besides, you can simply swipe on the alarms to acknowledge, delete and add maintenance policy without opening the alarm details. When you swipe on a particular alarm, options for acknowledging, deleting and adding maintenance policy to the alarm will appear as shown in Figure 9. Note that these options will appear only if you logged in as a user with privileges to acknowledge or delete the alarms or add maintenance policy.
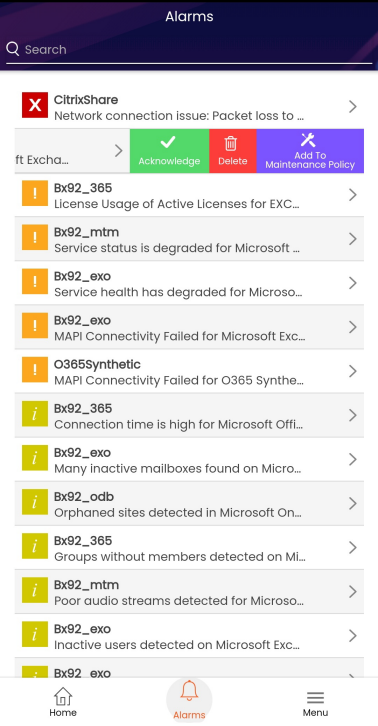
Figure 9 : Acknowledging/deleting/adding maintenance policy to alarms by swiping on the alarms
To add maintenance policy to the alarm, click on the Add to Maintenance Policy option. This will invoke the options to set the maintenance policy as shown in Figure 10.
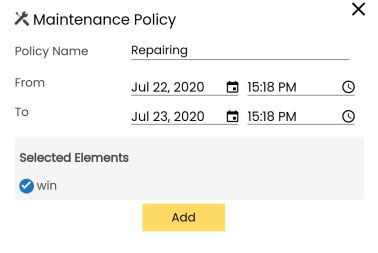
Figure 10 : Setting the maintenance policy
To add a new policy, specify the following in Figure 10.
- Provide a name for the new policy against the Policy name text box.
- Then, specify the duration of maintenance using the
 and
and  icons in the From and To fields.
 - The Selected Elements section will display the alarm/alarms chosen.
You can also delete multiple alarms or add maintenance policy to multiple alarms. To achieve this, long-press on any of the alarms to activate the check buttons before the alarm names (see Figure 11). Then, select multiple alarms of interest to delete or add maintenance policy. Note that these options will appear only if you logged in as a user with privileges to delete the alarms or add maintenance policy.