Drive top performance from AIX Servers. Ensure peak performance of applications including web servers, database servers, middleware, messaging, etc. through comprehensive monitoring of all aspects of AIX OS performance.
Free TrialTrusted by leading companies

IBM AIX is one of most widely used Unix operating systems in use in IT infrastructures today. A recent IDC worldwide server tracker assessed that AIX has a 58% of the Unix server market. AIX is widely used to support enterprise applications in various domains including banking, retail, telecom and insurance. The availability and performance of AIX servers and the applications they host is critical for ensuring that business can operate effectively. Slowdowns can result in frustrated users, loss of productivity and increased support costs for the enterprise.
AIX servers are often also virtualized - the logical partition virtual machine technology (LPAR) is a full virtualization solution. In a virtualized deployment, performance monitoring is even more important. If a server goes down or slows down, all the logical partitions (LPARs) may fail or slow down. Thus, a single server can bring down a number of business-critical applications. Hence, the need to effectively monitor AIX servers is growing.
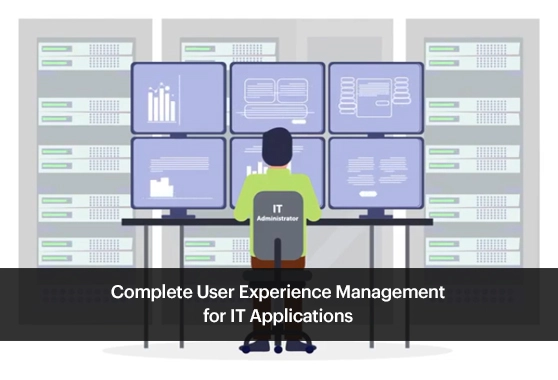
eG Enterprise is a 100% web-based performance monitoring solution for AIX infrastructures. eG Enterprise provides a single console from which administrators can track the status of their AIX server farms, receive alerts when problems happen, view reports on historical performance, and plan the capacity of their server farms.
To monitor a AIX server, eG Universal Agent can be deployed on the server in a matter of minutes with very little configuration required. Agentless monitoring is also supported. Administrators can choose the servers to be monitored with agents (e.g., critical production servers) and those that can be monitored in an agentless manner (e.g., staging servers).

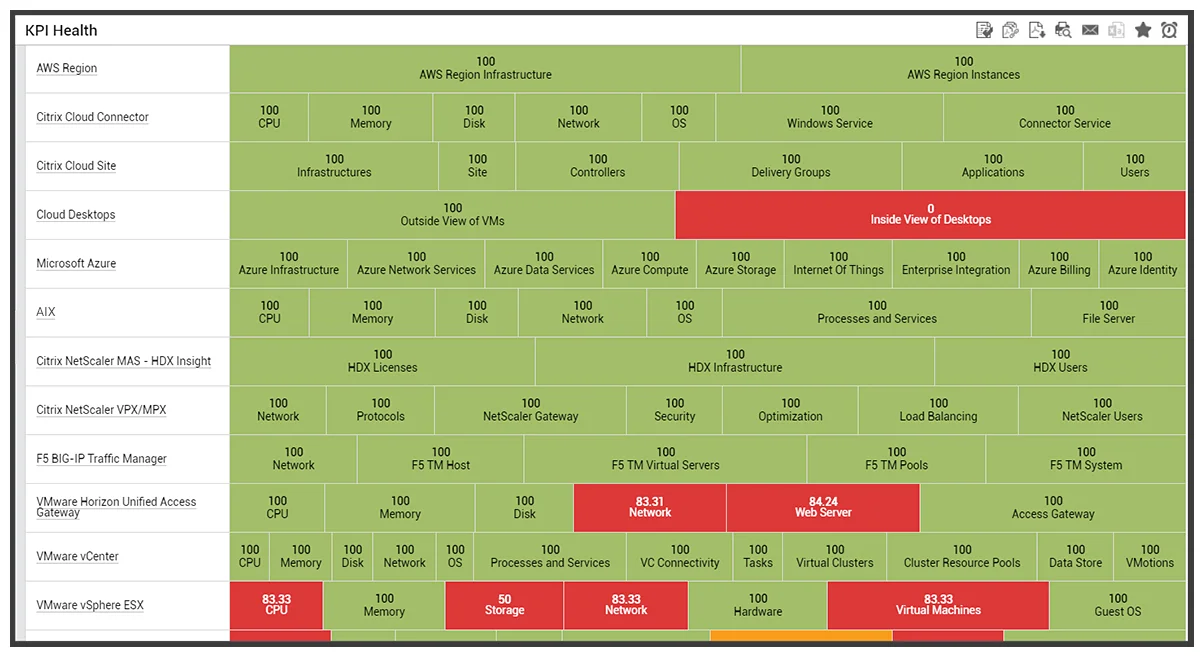
Key features include:
eG Innovations delivers a robust, reliable and extremely valuable solution to deliver maximum uptime and user satisfaction. Pre-emptive alerting helps us to address performance issues immediately before they affect system and application availability![]()

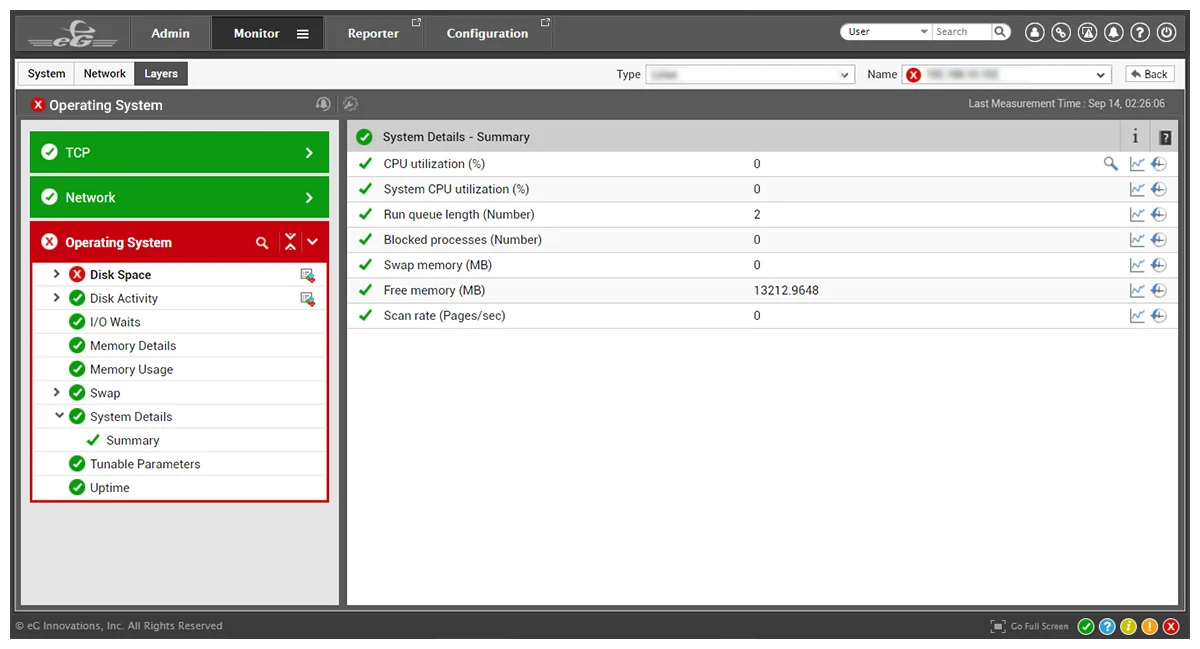
To monitor server hardware, eG Enterprise relies on native AIX commands, and integration with IBM Director is also supported. Monitoring of the server operating system is based on native commands and scripts. Every aspect of operating system performance - including the usage of key CPU, memory, disk and network resources are tracked, plus system logs.
The same agent that monitors the AIX operating system can also be used to monitor applications running on the server. Popular applications like the IBM WebSphere web server, IBM WebSphere Java application server, IBM DB2 Universal Database (UDB), IBM WebSphere MQ messaging server, etc., can be monitored. Other applications hosted on AIX such as Oracle database servers, WebLogic or JBoss application servers, enterprise applications like SAP and others can also be monitored using eG Enterprise. For a complete list supported platforms, see here.

eG Enterprise offers ready answers to all the key questions that an IT administrator may have about an AIX system:
For effective AIX monitoring, administrators need access to metrics from every layer of the server. They should be able to compare performance across these layers to diagnose exactly where the performance bottleneck lies. While server monitoring is important, administrators also need to be able to look in-depth into application performance. eG Enterprise addresses all of these key AIX monitoring requirements.
eG Enterprise uses a unique layer model representation to depict the performance of different layers of an AIX server (e.g., hardware, operating system, network, TCP/IP, application processes, etc.). A similar layer model representation is also used for other operating systems that eG Enterprise supports (e.g., Microsoft Windows, Solaris, Linux, HPUX, OS/400, and OpenVMS). This way, eG Enterprise provides a single pane of glass from where administrators can monitor their heterogeneous multi-vendor data center servers from a single console and with a single unified representation model. This greatly simplifies the monitoring and management of heterogeneous server farms.
Baselines for all the key metrics are pre-defined in eG Enterprise based on industry standard best practices. eG Enterprise can also determine automatic thresholds for other metrics based on an analysis of past history. The actual metrics are compared with the thresholds to determine where the problems lie in the infrastructure.
With eG Enterprise in place, AIX administrators can start receiving alerts when a key process fails, a critical event is logged in the server log, or when a disk fills up.
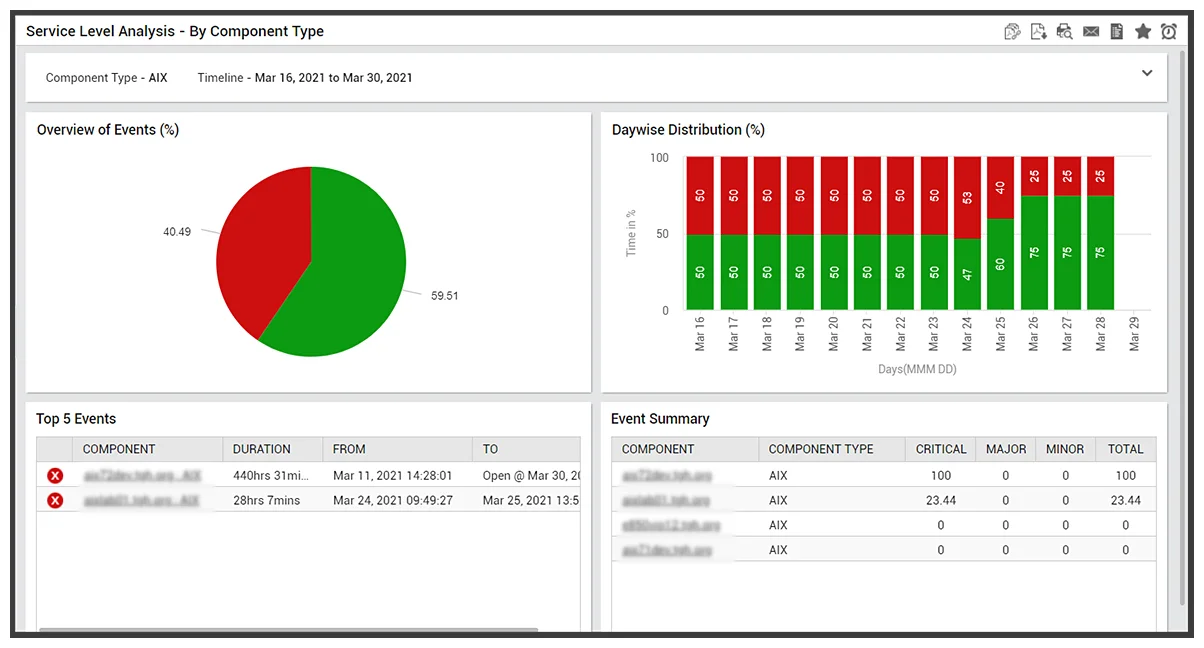
eG Enterprise also provides extensive web-based reporting of all the collected metrics. Admins can receive periodic, detailed reports of the performance of their server farm without even logging into the console.