I recently published an article on Citrix Performance Analytics (also called Citrix Analytics for Performance), part of the Citrix Analytics service in Citrix Cloud. In this article, I will analyze where Citrix Performance Analytics fits in relative to other Citrix performance monitoring and management tools in the market.
- What is Citrix Analytics?
Citrix Analytics is a Cloud-based service that works across Citrix portfolio products and third-party products. It gathers data from these products (or data sources) and uses built-in Machine Learning (ML) algorithms to detect anomalous behavior of a user or any other entity. It then monitors and troubleshoots user sessions, and views operational metrics for users and share links across an organization that uses Citrix products. - What is Citrix Analytics for Performance?
Part of the Citrix Analytics service, Citrix Analytics for Performance provides visibility into the performance of Citrix Virtual Apps and Desktop Sites across an organization. - What is Citrix Director?
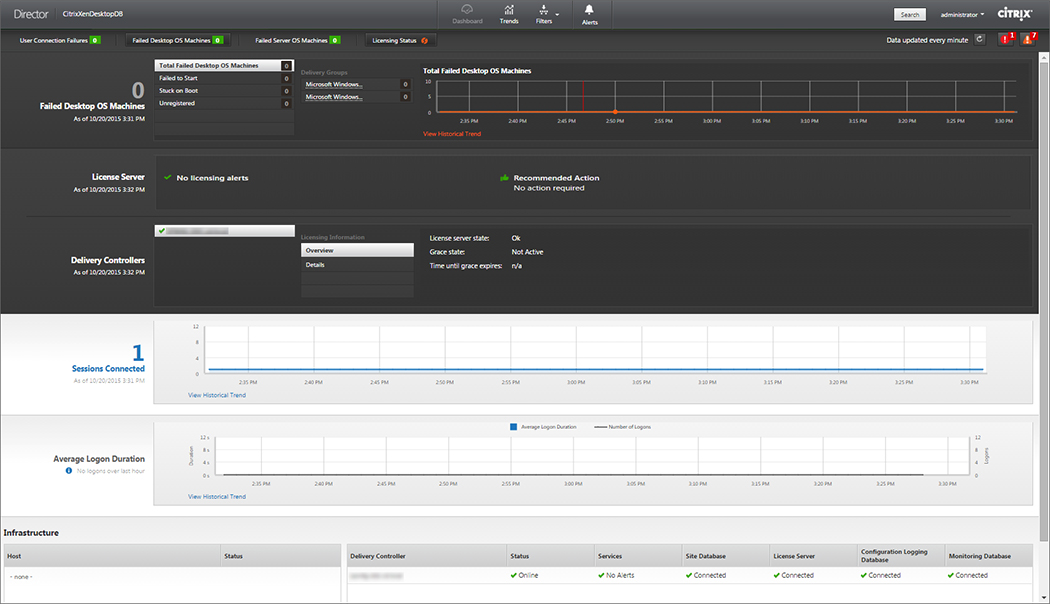
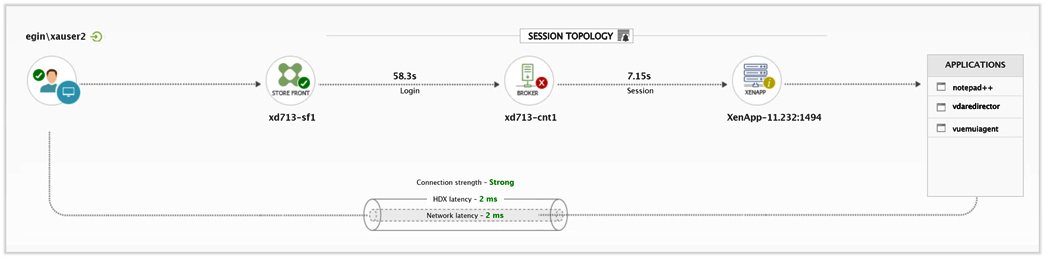
Citrix Director is a web-based monitoring console for Citrix Virtual Apps and Desktops virtualization platforms that allows administrators to control and monitor virtual applications and desktops.
The Importance of Monitoring Citrix User Experience
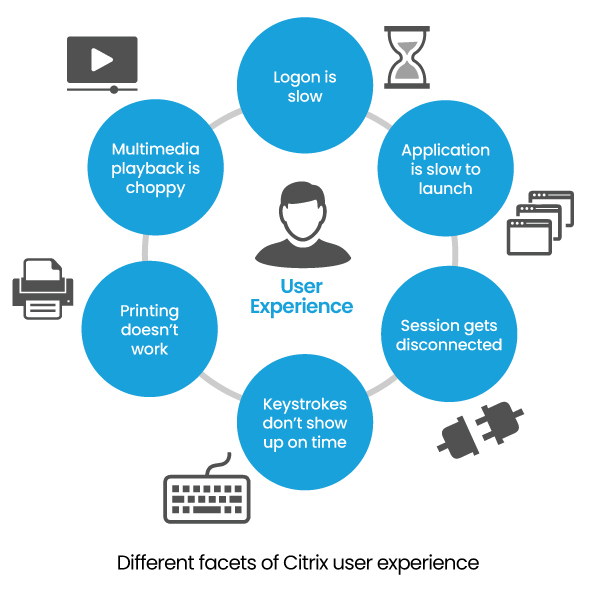 As a short recap, user experience monitoring is becoming a more popular way of monitoring an end user computing environment such as Citrix Virtual Apps and Desktops. As any Citrix administrator will tell you, user experience is top of mind. It is important that we deploy applications and desktops to our end-users so they can be productive wherever they work from, but if the user experience is poor then that effort begins to address the issue.
User experience monitoring takes a new angle and tells the story of your environment in a different way than traditional monitoring solutions which focused mainly on key resources in use in your environment. User experience is top of mind for us, so how can we quantify it in a more-precise way?
What Citrix Performance Analytics Provides
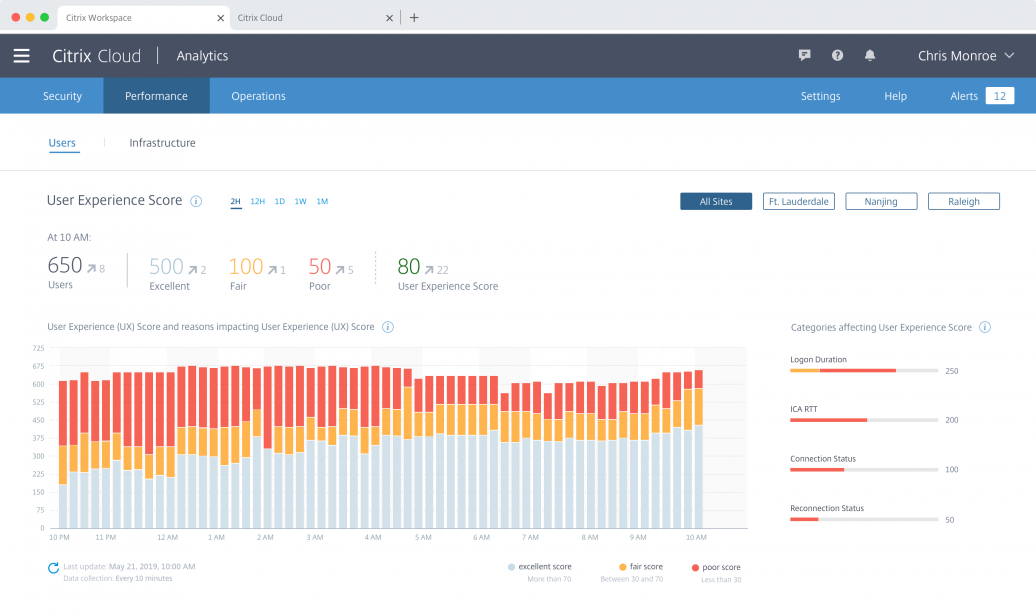 This is where Citrix Performance Analytics steps in. It calculates the user experience for every user who accesses apps and desktops from your on-premises Virtual Apps and Desktops deployment, or Citrix Cloud hosted service, and categorises users into Excellent, Fair, or Fair user experience (UX) categories.
There are a number of key performance indicators that make up the overall User Experience score. These include:
- Logon duration
- Session responsiveness
- Session availability
- Session resiliency
If all these performance indicators are within excellent thresholds, the user experience is calculated as Excellent. If some or all key performance indicators measure in at high values, your users may drop into Fair or Poor user experience categories.
User Experience score, along with Infrastructure Analytics, part of Performance Analytics, allows you to easily see which of your users are not receiving the best user experience. You can then focus your efforts on rectifying the problems causing poor user experience.
The performance indicators used for computing the User Experience score are not computed directly by Citrix Performance Analytics. Instead, this service relies upon a number of data sources.
- Information about logon duration, session responsiveness, session availability etc. are obtained from Citrix Director and Citrix Delivery Controller installed on-premises or their equivalents on Citrix Cloud. Version 1909 or later is required for this integration.
- For Performance Analytics to obtain network related statistics from your on-premises environment, you must configure your on-premises Citrix Gateway with Citrix Application Delivery Management (ADM) Service in Citrix Cloud. Citrix Gateway versions 12.1.x.x and later are supported.
You can read the detailed article on Citrix Performance Analytics here.
How does Citrix Performance Analytics compare with Citrix Director?
 We shouldn’t actually compare Citrix Director with Citrix Performance Analytics. They are different products and behave in different ways.
As indicated earlier, Citrix Director actually feeds performance metrics up to Performance Analytics. From an on-premises perspective, I have to connect Director to Performance Analytics before I can calculate the user experience for users connecting to my on-premises deployment. This means I still need Director in my environment, but it is not the only reason.
For Citrix Cloud deployments, your Director (Monitor) data is already connected to Performance Analytics for you.
 Whilst the two products collect much of the same data such as your logon times, session failures and so on, Director reports that to the administrator for reporting on. Citrix Performance Analytics actually consumes the data into its machine learning engine, and from there is able to calculate the user experience for each user accessing your Virtual Apps and Desktops resources.
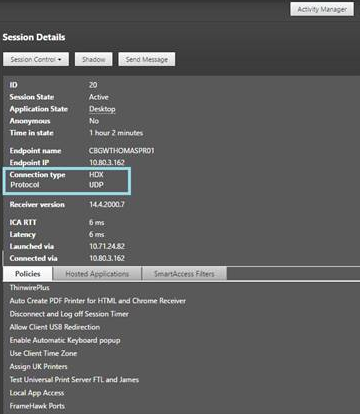
Citrix Director also provides additional performance data that is not used by Citrix Performance Analytics currently. For instance, CPU, memory and disk utilization on your VDAs can be tracked by Citrix Director. It also looks at application usage and can report on the number of instances of applications in use in your site. An overview of the health of your hypervisor is also available in Citrix Director. Administrators can also use Citrix Director to perform actions – e.g., to send a message to a user, to shadow a session, to logoff a user, etc.
Overall, Citrix Performance Analytics is a user experience analytics solution. Citrix architects and executives can use this tool to understand how well they are supporting their users. This is something that has become very important, now that most organizations have 100% of their employees working from home. On the other hand, Citrix Director is an administration and troubleshooting tool. It provides a lot more granular detail than Citrix Performance Analytics and is intended to be used by the Citrix helpdesk staff and Citrix administrators.
Do I still need Third-party Citrix Monitoring Solutions?
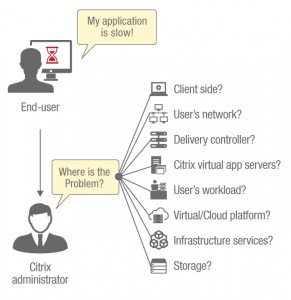 Over the years, several vendors have developed monitoring tools for your Citrix platforms. Vendors like eG Innovations, ControlUp, Goliath Technologies, and Lakeside Software have offered monitoring, diagnosis and reporting solutions for Citrix for years. So how do these tools compare with Citrix Performance Analytics and Director? Do I really need these solutions to monitor my Citrix environment?
It is quite simple really, from my perspective, you still need core monitoring solutions in your environment. They actually greatly assist Citrix performance monitoring. Do not view Citrix Performance Analytics so much as a monitoring product.
When you think about it, Performance Analytics looks at key performance metrics that makes a user experience great. That is, session logon duration, session responsiveness (ICA RTT/latency), session failures and so on. It is not necessarily the job of Performance Analytics to pinpoint why a performance metric takes an extra-long time.
You still need the core monitoring solutions to monitor the availability of your VDAs, the core Citrix management layer if deployed on-premises, and of course all the other infrastructure needed to not only run a Virtual Apps and Desktops deployment, but ensure it runs optimally. That is, your network layer, infrastructure layer made up of Hypervisors, Storage, Datacentre equipment, and then your other core hosting components like DNS, Active Directory, DHCP and so on.
As such, to help you understand why monitoring solutions like eG Enterprise actually compliment Performance Analytics, I’ve drawn up some examples below.
Example 1 – Long Logon Times – High GPO Processing
Logon duration is one of the most important user experience metrics for an end-user, and Citrix administrator. Citrix administrators often put in a lot of work to drive down logon times across their environment, but it is often an ongoing battle as changes made to the environment, including the introduction of new code for example when Virtual Apps and Desktops is upgraded, has the potential to add on seconds to the logon time.
Other factors can periodically affect logon times. For example, the network may suddenly have a slow period, there could be packet loss, or outside of the network desktops and application servers could grind to a halt. The logon process is sensitive to any small change in the environment.
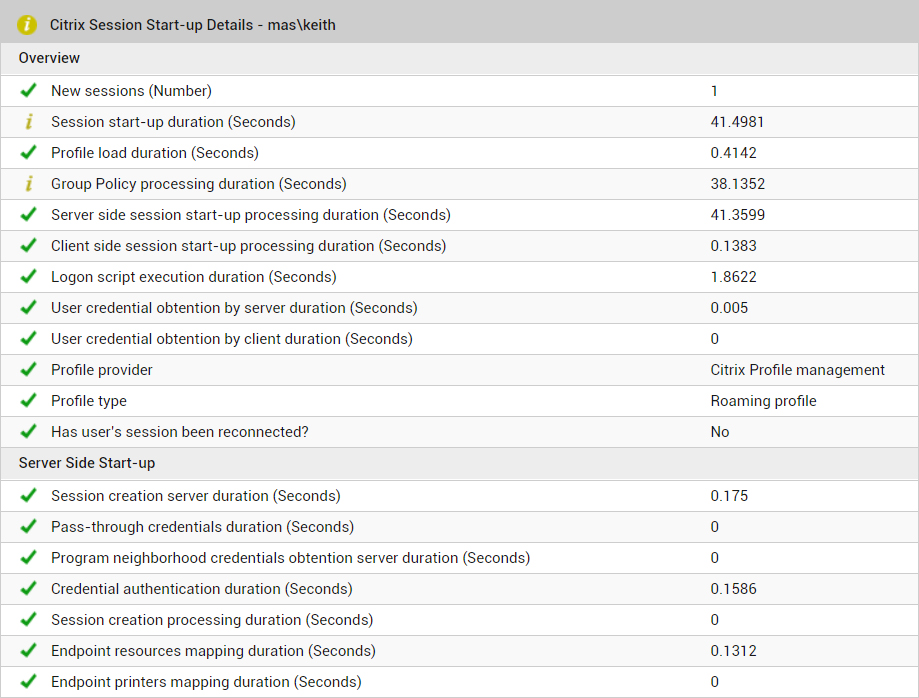
If we take the example where Performance Analytics is reporting slow logons, which is impacting the User Experience score for 25% of your connected users. You notice that the Group Policy processing times are what is causing this slowness. However, you understand that no changes have been made to Group Policy over the past couple of weeks, so there should be no issues.
Maybe a portion of your Citrix VDAs are having issues contacting your Domain Controllers. They experience packet loss, or very high latency. Those desktops may be isolated within a particular datacentre. This explains why only a portion of your entire user base is affected.
A traditional Citrix monitoring product like eG Enterprise will already be monitoring latency and any packet loss between your VDAs and corporate Domain Controllers. The Domain Controllers are a critical piece of your infrastructure, and any issue with them will certainly affect logon times and cause many other issues.
In this example, the traditional monitoring product was able to identify that there was high latency between the VDAs and Domain Controllers, which resulted in GPO processing times increasing greatly.
Example 2 – High Session Reconnect Rate
If your users constantly have drops in connection to their applications and desktops, Performance Analytics calculates this with the key Session Resiliency indicator. A network drop can often happen when remote working, and that is most likely where you will experience such behaviour.
However, it is also possible to happen within the corporate network. Take the example where an organisation has multiple departments and buildings around campus, connecting into core datacentres. All the different connections from PCs, Laptops, and other networking devices plug into local switches and so on which allows traffic to reach the datacentre.
There are many components in the middle of an end-user’s connection to Citrix VDAs, so plenty of hops a packet must take to get from A to B. It also is not just the networking stack that can cause disconnections. For these reasons, you cannot simply rely on not having traditional monitoring products to help find root cause.
If there are network blips, proxy issues, Hypervisor hardware outages, the traditional monitoring solution will alert you to these and many times help prevent network disruptions affecting your ICA channels.
Example 3 – Session Launch Failures Due To Failed VDAs
A lot of the time, when an end-user attempts to establish a session on Citrix and they cannot, it can be due to failed desktops or application servers. Infrastructure Analytics is part of the Performance Analytics product, which reports on unregistered VDAs and so on, but you need to move outside of Performance Analytics to understand why that is.
Citrix VDAs can fail for a number of reasons. They could have encountered a crash, BSOD, or have frozen. They may also be stuck at the boot screen after a scheduled reboot, or the network has not initialised after powering back on.
This is where the traditional Citrix monitoring product helps pinpoint the exact issue. You can be alerted to these issues in real time, allowing you to discover root cause, and reduce or eliminate the impact on session availability for your end-users.
Comparison Matrix
| Citrix Performance Analytics | Citrix Director | eG Enterprise | |
|---|---|---|---|
| Aggregated view of user experience metrics across multiple sites | Yes | ||
| Session failures, connection attempts | Yes (data from Citrix Director) |
Yes | Yes |
| Logon time, session latency | Yes (data from Citrix Director) |
Yes | Yes |
| Resource usage of session hosts | Yes | Yes | |
| Monitoring of all Citrix supporting tiers | Limited | Yes | |
| Synthetic monitoring | Minimal | Yes | |
| Remote control of sessions/servers | Yes | Yes | |
| Monitoring of supporting infrastructure – network, AD, file servers, hypervisors, cloud | Yes |
eG Enterprise is an Observability solution for Modern IT. Monitor digital workspaces,
web applications, SaaS services, cloud and containers from a single pane of glass.
Summary
Citrix Performance Analytics makes it a lot easier for executives to see the user experience their Citrix environment is delivering to users. Getting solid evidence that a user’s experience is poor eliminates any guessing that we may have had to do before when troubleshooting end-user performance issues. Administrators can use this data to fine-tune their infrastructure to make user experience great.
However, there is still a need to monitor the environment using traditional monitoring products like eG Enterprise. If servers go offline, there is latency, services have stopped, disk space becomes low etc, we need to know about it. Ultimately a lot of these issues are caught by the traditional monitoring product before they impact the user experience and end up reflecting in a system such as Performance Analytics.
So, use both, hand in hand. The more effective you can be at monitoring your Citrix deployment in a proactive manner, the better and more consistent any user experience will be. On top of that, with Performance Analytics, you can spend time better by working with the users who actually need your assistance. No more guessing or being reactive to user performance issues.
eG Enterprise is an Observability solution for Modern IT. Monitor digital workspaces,
web applications, SaaS services, cloud and containers from a single pane of glass.