


What is ICA Latency? – Difference between ICA RTT vs ICA Latency
 Also referred to as Citrix Latency, it is essentially the network latency, which measures the time it takes for data to be transferred from one place to another over a network. For example, when you send a data packet from one computer to another located in a different region, the time taken for the packet to traverse the network constitutes the latency. High ICA Latency indicates a sluggish network, affecting the overall performance and responsiveness.
ICA RTT (Round Trip Time) is the time interval between a user’s action and the graphical response displayed on their screen. This metric encompasses ICA Latency, Endpoint Delay, and Host Delay, providing a comprehensive measure of the system’s responsiveness. By combining these various delays, ICA RTT offers a clear picture of the user experience, highlighting any performance issues that might arise from network or system sluggishness.
In summary, when comparing ICA RTT vs ICA Latency, ICA RTT gives a broader view of the total response time, while ICA Latency focuses on the network component of the communication. Both are crucial for diagnosing and optimizing the performance of ICA sessions.
In the scenario of a Citrix environment, maybe you have a user working from home who is using Microsoft Word delivered as a published application via Citrix Virtual Apps and Desktops (CVAD). Each keystroke that the user makes on their keyboard into the published application is being sent to the Citrix Virtual Apps server that is hosting the Microsoft Word application. As each keystroke is sent to the Virtual Apps server, they are processed, and the screen is redrawn for the user allowing them to visually see what they just typed.
Any extended delay in this process can be a delay that is perceivable to the end user as a sluggish and slow response to keystrokes and mouse input and in extreme cases, this may even be noticeable to the naked eye. In most cases, this will be perceived by end users as the application running slow which can generate those “Citrix is Slow” complaints you hear being reported to the helpdesk.
ICA Data Flow
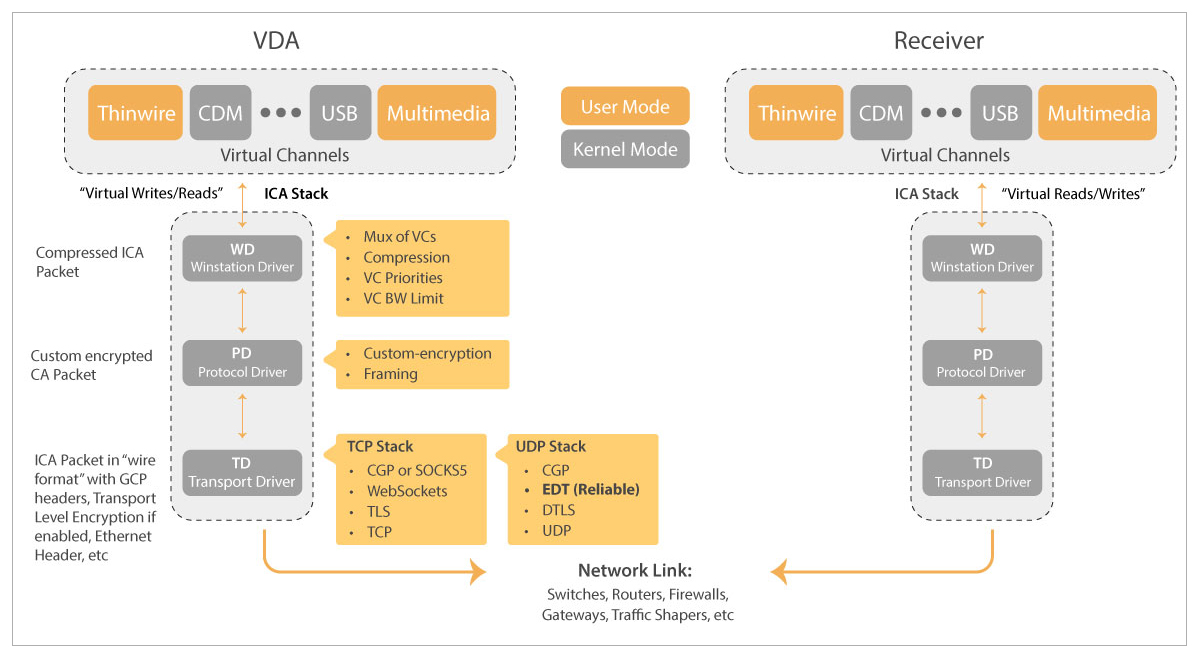
When it comes to ICA data flow and processing, things can get a little complex as you can see from the below diagram. It isn’t just a case of sending an ICA packet from Point A to Point B. Instead, you have Citrix ICA Virtual Channels (Thinwire, Multimedia, USB etc) on both the Citrix Virtual Apps server and the client endpoint which is running Citrix Workspace app. Each of these Virtual Channels are responsible for processing data.
You also have a bunch of drivers like the Winstation driver which is responsible for sending Virtual Channel data to the Citrix Virtual Apps server over the ICA connection.
Then there are non-Citrix components that sit between your endpoint and the Citrix Virtual Apps server, such as routers, firewalls, switches, etc. These are all devices that the ICA traffic must pass through. If any of these devices are underperforming, they may process the ICA traffic slower and this results in increased overall latency.
Top Digital Workspace Challenges
In a Digital Workspace and Performance Monitoring survey conducted by eG Innovations recently, the top Digital Workspace challenge was network connectivity and bandwidth issues at the user end. A total 43% of respondents mentioned this.
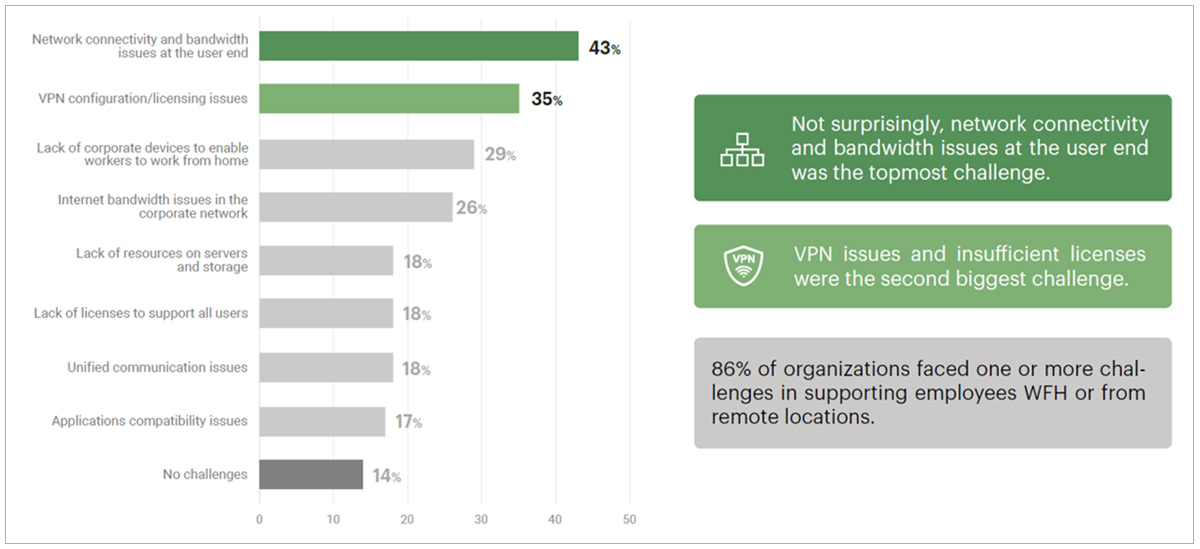
Source: Digital Workspace & Performance Monitoring in the New Normal – Survey Results
This would point to the challenges around remote working and the increase of full remote working or hybrid working which is still very much in place within most organisations. Once users work from home, IT typically loses sight of the user’s network connection. The user could have a poor Wi-Fi connection or working from a public coffee shop where internet connectivity is limited due to congestion. These types of issues can cause those “Citrix is Slow” type complaints as typically the user will believe that their network connection is fine, and it is “Citrix” having the problem.
How Does Latency Affect End-User Experience?
When it comes to how latency affects the end-user experience, it is quite simple. If a user notices any delay when they are clicking or typing while using a Citrix published application or desktop, they can’t complete their tasks just as quickly as they might normally, and they will become frustrated. The user could even be watching a training video or listening to audio which is choppy and hard to follow.
The user could even be transferring data to or from their Citrix session and any latency will add further time for such a task to complete.

In scenarios like this, the user is likely to wait a short time to see if the issue self-resolves itself before calling the IT helpdesk to complain.
When latency impacts the digital user experience (DEX), productivity is typically lost as a result, and this has an impact on the business.
How Does Citrix Latency Impact the Business?
In the scenario where a user has been experiencing latency issues, there may be times when the same latency issue impacts a wider range of users. Take for example, when an application starts to run slow for all users. Initially a couple of support tickets are logged with IT who then begin to investigate and it takes 2-3 hours to find the root cause of the problem.
 The issue turns out to be latency, which caused the application to appear to be running slow. If an hour of work per user is on average worth $200 to the business, then the business could be losing up to $300,000 in productivity for this incident alone if 500 users were impacted for 3 hours.
Then you have to account for the time that the IT team spent working on and resolving the issue. For example, maybe you have 10 staff members involved from initial frontline IT to senior Citrix support and members from the storage, virtualisation, and networking teams. This could have cost the business a further $5,000 when you account for their wages and productivity loss.
What are the Components of Citrix Latency?
There are typically two metrics which relate to a Citrix Virtual Apps and Desktops environment.


- Latency : Otherwise known as ICA Latency. This is the bottom-line network latency and ICA stack latency between the client endpoint and Citrix Virtual Apps server. Think of this as similar to a ping test. The performance of either endpoint or server could increase ICA Latency. In the screenshot in Figure 4, latency is measured at 158 ms.
- ICA RTT : ICA Round Trip Time, or ICA RTT, is both ICA Latency and Thinwire latency basically meaning the time it took between a user clicking or typing into a Virtual App or Desktop, and the moment that action is processed and displayed for the end-user. ICA RTT can be more easily known as screen lag. Application performance, the network, graphical rendering, or the performance of the Virtual Apps server could increase ICA RTT for example.
How to Monitor Latency and What Tools do Citrix Offer?
Citrix Director
Citrix Director is one of those tools that every Citrix administrator has used and is familiar with. It can drill into active HDX / EDT user sessions to show what is going on, including displaying the real-time Latency and ICA RTT metrics as shown in the below screenshot.
If you have NetScaler Gateway in your environment, depending on if you have a Virtual Apps and Desktops Premium license you can integrate Citrix Application Delivery Management (ADM) with Director for further network insight which I will touch on next.
Citrix Application Delivery Management
Citrix Application Delivery Management (ADM) can be deployed as a standalone appliance within your on-premises environment or consumed as a Citrix Cloud service.
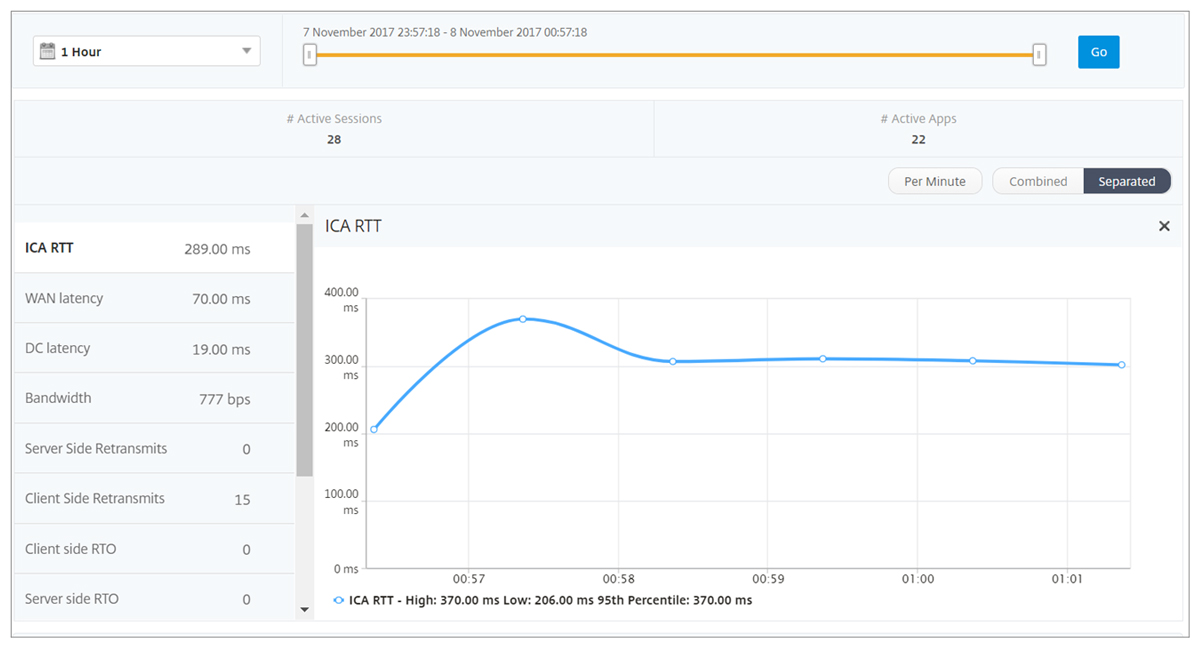
ADM can further drill into the HDX session and capture latency metrics to help identify where the cause of latency might be. Some of the latency related metrics it captures are:
- ICA RTT : Basically, the screen lag that a user experiences when interacting with their Citrix Virtual App or Desktop.
- WAN Latency : Latency caused by the client side of the network, in other words between the end-user device and NetScaler Gateway.
- DC Latency : Latency caused by the server side of the network, in other words between the NetScaler Gateway and Citrix Virtual Apps servers.
- Bandwidth : The total bytes per second taken for end-to-end communication during the selected time interval.
- Server Side Retransmits : The number of packets retransmitted between the NetScaler Gateway and backend Virtual Apps server. A high value could indicate a network issue within the datacentre.
- Client Side Retransmits : The number of packets retransmitted between the NetScaler Gateway and user’s endpoint. A high value could indicate a network issue.
The screenshot below shows some of the metrics I have discussed. You can view the ICA RTT, WAN Latency, DC Latency and so on for particular user sessions over a period of time. Data can also be held historically depending on the NetScaler license that you have.
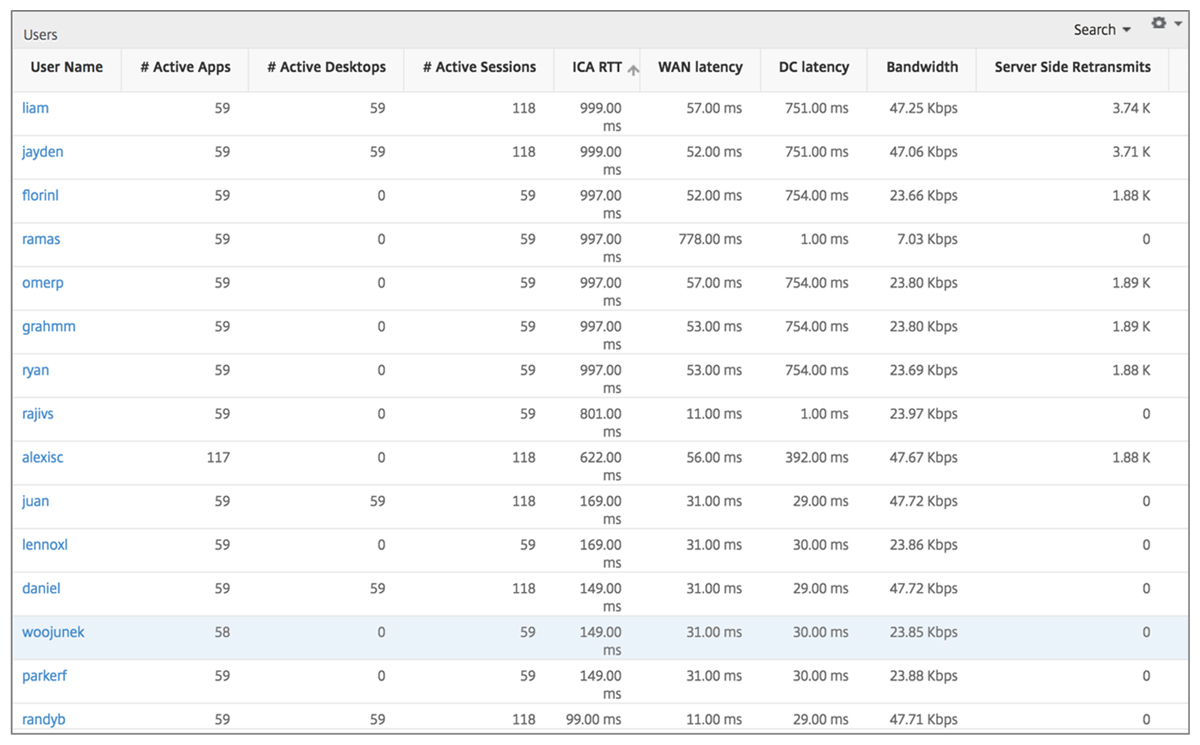
If you want to view the key metrics at a high level, you can do just that, and this could be useful if a portion of your user base is reporting issues. Here you could identify who exactly is being impacted which might help to narrow the issue down further.
Citrix Performance Analytics
Citrix Performance Analytics is another potential product you can use to track Citrix latency. This is a subscription-based Citrix Cloud offering that comes either as a standalone offering or bundled with Citrix Analytics for Security. The product can pull metrics from either Citrix DaaS Sites or on-premises Sites to aggregate and report on the data centrally.
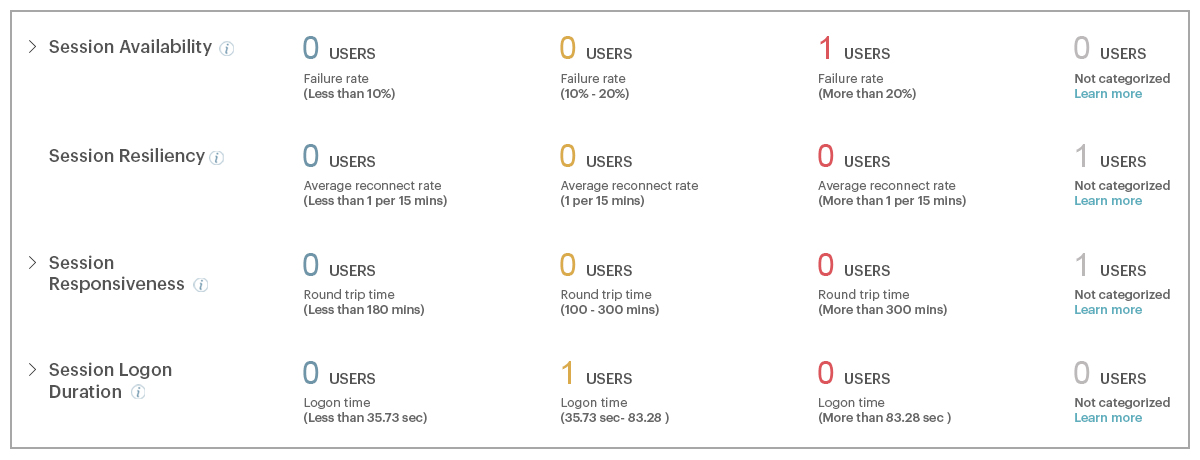
Citrix Performance Analytics captures and reports on a lot of the user experience type data that Citrix Director handles, but the key differentiator is how that data is displayed. Citrix Performance Analytics scores each “key performance indicator”, such as Session Responsiveness (Latency) and categorises them into Poor, Fair, or Excellent buckets.
Depending on how high latency is, the Session Responsiveness performance indicator will be categorised appropriately. So, for example, if latency is above 300ms, the user will fall into the Poor bucket for Session Responsiveness.
Tips and Tricks to Avoid High Citrix Latency
This article wouldn’t be complete without providing some tips to reduce Citrix latency! Here are some quickfire tips before we delve a little further into some of the points.
- Citrix Gateway – Place the Citrix Gateway close to where the Virtual Apps or Desktops are. This ensures that the latency between the Citrix Gateway and end-users is minimized. Of course, this may mean that users are still far away from the Gateway, but hopefully you have datacentres or public cloud presence where the majority of your users are.
- Adaptive Transport – With Adaptive Transport, ICA traffic will be transferred from point-to-point using UDP as opposed to TCP. UDP is typically more efficient than TCP when there is high latency on the network, which can often be the case when working remotely.
- Citrix DaaS/Cloud – If you have users all over the world, Citrix DaaS and public cloud hyperscalers such as Microsoft Azure can help you bring applications and desktops closer to where the users are located, allowing you to get a handle on latency. Citrix Cloud has what is known as the Citrix Gateway service for example, which is distributed across the world and users connecting via this service will be connected to the closest one available to them, helping to minimise latency and achieve the best user experience.
- Audio over Real-Time Transport – Audio over RTP uses the Real-Time Transport protocol to transport audio traffic to the end-user device and can be useful in scenarios where latency is impacting a Citrix session.
- Connection Quality Indicator – The Connection Quality Indicator is a tool you install on your Citrix Virtual Apps or Desktops and displays a status of the connection health to users. If latency breaches a particular value the user can be informed and this may prompt the user to refer to a Remote User Guide that they have been provided by IT, allowing them to correct the problem themselves if the issue is coming from the end-user’s network.
- WAN Friendly Policies – You can configure policies within Citrix Studio that are more friendly to WAN connections.
- Remote User Guides – Technology itself is not the only answer. You should also give advice to staff when working from home and this can be achieved with easy-to-follow user guides that explains some best practices when working from home such as using a hardwired connection if possible, avoiding streaming or other bandwidth hungry activities, working close to where the router is if using W-Fi and so on. This practice could reduce the number of tickets that reach the helpdesk due to “Citrix is Slow” issues that is being caused by factors outside of IT’s control.
- Offloading Multimedia – Multimedia content is rife in today’s world. Not a day goes by where we don’t watch some sort of video content. Unfortunately, video can impact latency but there are things we can do to avoid this, with multimedia offloading being one of them. Microsoft Teams offloading, and Browser Content Redirection (BCR) are two ways that can offloading audio and video to the endpoint to be processed rather than being processed on the Citrix server.
What is Adaptive Transport?
As mentioned, Adaptive Transport gives you the option to utilise EDT (Enlightened Data Transport) over UDP for ICA traffic, instead of using TCP.
Typically, Adaptive Transport can handle latent connections better than TCP can, which can prove beneficial for remote workers who will always have a higher risk of latency than a user within a corporate office would.

Configuring Adaptive Transport
To make use of and Adaptive Transport, there are a couple of things that need to be configured.
- Allow UDP 443 from the Internet to your external facing NetScaler Gateway appliance. Then, allow the NetScaler SNIP to communicate with the Citrix Virtual Delivery Agents (VDAs) over UDP 1494 and 2598.
-
Make sure the Citrix Policy “HDX Adaptive Transport” is set to “Preferred”, which it is by default.
 Figure 8: Configuring HDX Adaptive Transport
 - If you are using Citrix DaaS and you proxy ICA connections via the Citrix Gateway service, you will want to use the Rendezvous protocol which allows VDAs to bypass the Citrix Cloud Connectors when communicating with the Citrix Gateway service.
Verifying Adaptive Transport
Once you have configured Adaptive Transport, to actually verify that it is being used there are a couple of ways to do this.
- You can leverage the Citrix Connection Quality Indicator tool which displays the underlying ICA protocol being used within a session.
-
Citrix Director after searching for the user in question can show which protocol is being used.

-
On a VDA you can launch a command prompt and run CtxSession /0 which will show if the session is using TCP or UDP.
Audio Over Real-Time Transport Protocol (RTP) Configuration
When there is network congestion or packet loss, Citrix recommend that you configure RTP for Audio to ensure the best possible user experience. To configure it there are a few requirements:
-
Set the Citrix Policy “Audio quality” to “Medium – optimized for speech”.
 Figure 9: Setting the Citrix Policy “Audio quality”
 - Open UDP 16500-16509 between the end-user’s device and the Citrix Virtual Apps and Desktops servers for internal connections.
- Open UDP 443 from the Internet to your NetScaler Gateway, and then open UDP 16500-16509 between the NetScaler Gateway and Citrix Virtual Apps and Desktops servers for external connections.
- For external connections, additionally ensure that DTLS is enabled on your Gateway Virtual Server.
- Instruct connecting endpoints to use RTP by either configuring Group Policy settings to control the RTP settings, or by editing the default.ica file on your StoreFront servers as shown in the below screenshot.

Connection Quality Indicator

The Connection Quality Indicator (CQI) tool aids users by displaying the health of the network connection when connected to a Citrix session. For example, if a user is working from home and suddenly there is an increase in latency, the CQI tool will detect this and display a soft notification to the end-user informing them that their connection strength is Poor, for example.
This tool is designed to provide the user with more information about the quality of their connection to Citrix and therefore the user may be able to resolve it themselves without having to contact IT by referring to the Remote User Guide I discussed earlier. It is similar to the signal bars of a mobile phone, users tend not to call Vodafone or Apple when their phone shows low signal strength and understand the issue is probably local to them.
It is also worth noting that the data collected by CQI is not stored anywhere or sent to Citrix Director, for example. It is only shown to the end-user.
Deploying Connection Quality Indicator
To deploy the Connection Quality Indicator tool, you can download the MSI from Citrix here, and then install it on your Virtual Delivery Agents (VDAs).
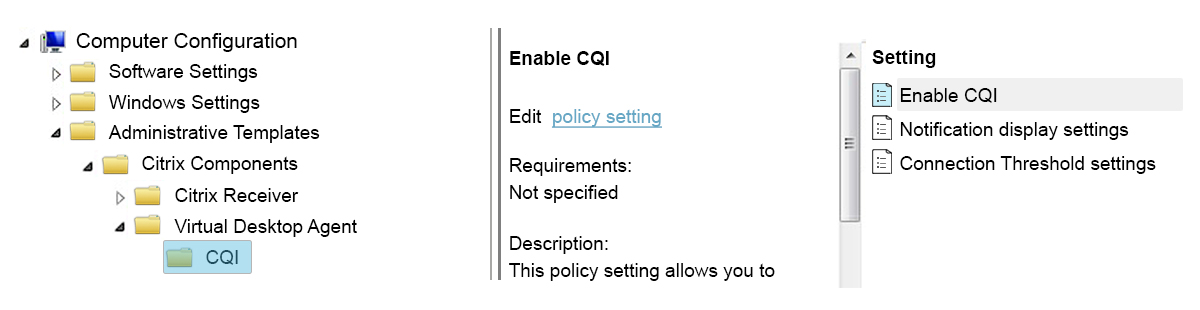
After deploying CQI, you can use Group Policy to configure it.
- Set the “Enable CQI” policy setting to enabled.
- Configure thresholds for Latency, ICA RTT, and Bandwidth using setting “Connection Threshold settings”. For example, maybe when latency breaches 300ms do you want to inform the user that their connection quality is poor. This value will be different across organisations.

Optimized for WAN Policy Template
The Optimized for WAN Citrix Policy Template is a good starting point for Citrix policies that are WAN friendly. Within Citrix Studio if you browse to Policies > Templates you will see the “Optimize for WAN” template which once selected can be used to create a new policy from.

What I would say is that not all settings will make sense or apply to your environment. Think of the template as your starting point, so review each of the policy settings carefully and you can of course tweak the settings or remove them completely where required.
Microsoft Teams Offloading
Microsoft Teams has exploded in usage over the past couple of years and is now found installed in many Citrix environments. The problem with Teams is that it can be resource hungry especially when used for video and/or audio calls. Fortunately, Citrix has developed Optimization for Microsoft Teams which offloads audio and video processing to the client endpoint.

This has a few benefits.
- Processing of audio and video which would naturally happen on the VDA is eliminated and shifted to the user’s endpoint instead. If the VDA has less work to do, ICA RTT will benefit from this. Also, other users sharing the same VDAs in multi-session scenarios or sharing the same underlying hypervisors will also benefit from the offloading.
- The amount of traffic being transmitted between the client endpoint and VDA is reduced.
- Audio and video quality will be greatly improved, so long as user endpoints meet the requirements to support Teams offloading. My Teams article goes into more detail about those requirements.
https://www.jgspiers.com/microsoft-teams-optimization-on-citrix/
Citrix Performance Without Teams Optimization
In the below example I am running a Teams audio and video call via a Citrix desktop and as you can see, there is high bandwidth with 30% CPU consumption.

Citrix Performance With Teams Optimization
In comparison, when Teams Optimization is enabled, an audio and video call results in the CPU dropping from 30% to 5%, and the bandwidth massively drops from over 1 Mbps to Kbps.

Browser Content Redirection
Browser Content Redirection (BCR) is another offloading technology which can be used to offload the rendering of webpages to the client endpoint. This is similar to the benefits of Microsoft Teams offloading whereby the Citrix server has less to do, and there is less traffic travelling between the Citrix server and client endpoint eliminating any Citrix latency concerns related to this traffic.
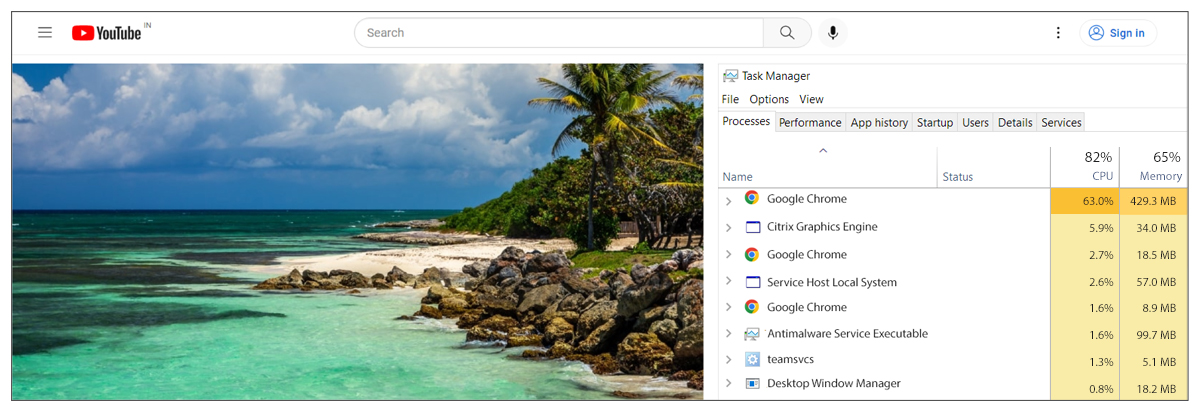
Web content that you can offload using BCR is YouTube, Microsoft Teams web, or even corporate training portals that deliver video content. The entire viewport as shown in the below screenshot is redirected to be rendered on the endpoint which helps reduce Latency and ICA RTT.

Citrix Performance Without Browser Content Redirection
In the below example I am watching a 4K YouTube video within my Citrix desktop and as you can see, the CPU is quite high at 82% and Memory 65%.
Citrix Performance With Browser Content Redirection
In comparison, when Browser Content Redirection has been configured to offload YouTube, the same video results in the CPU dropping by 70% on the VDAs, and memory for Google Chrome running within the VDA has dropped by 400 MB.
Configuring Browser Content Redirection
There are a couple of requirements to use Browser Content Redirection (BCR):
- Ensure that the Citrix Policy “Browser Content Redirection” is enabled which it is by default.
-
Configure the list of sites you wish to offload via BCR using the policy “Browser Content Redirection ACL Configuration”. For example, defining https://www.youtube.com/* captures all YouTube resources.

-
Deploy the BCR extension to Google Chrome or Microsoft Edge on your VDAs. You can either do this manually or by using Group Policy as shown in the below screenshot example.

For a full list of requirements and instructions you can always refer to the blog article I wrote for Browser Content Redirection: https://www.jgspiers.com/citrix-browser-content-redirection/
Are Citrix Tools Enough or Do We Need Third-Party Products?
You might be left wondering if Citrix Monitoring Tools are enough to monitor and troubleshoot Citrix latency issues, or if you should also leverage third-party monitoring products. We can cover this easily by looking at some of the positive and negative points:

One of the key points is that there are many other components that can cause Citrix latency. Things like the end user network, routers, firewalls, underling hypervisors, storage appliances, all need to be working correctly and performant to avoid impacting latency. To monitor such components and devices and pinpoint root cause, you need other monitoring products because Citrix Director, ADM, and Performance Analytics will not monitor and alert on your storage device, or your datacentre firewalls, for example.
As you can see from the below picture, a Citrix environment is complex and made up of many different components. You can imagine the difficulty in finding root cause to an issue if you are limited in what you are monitoring.
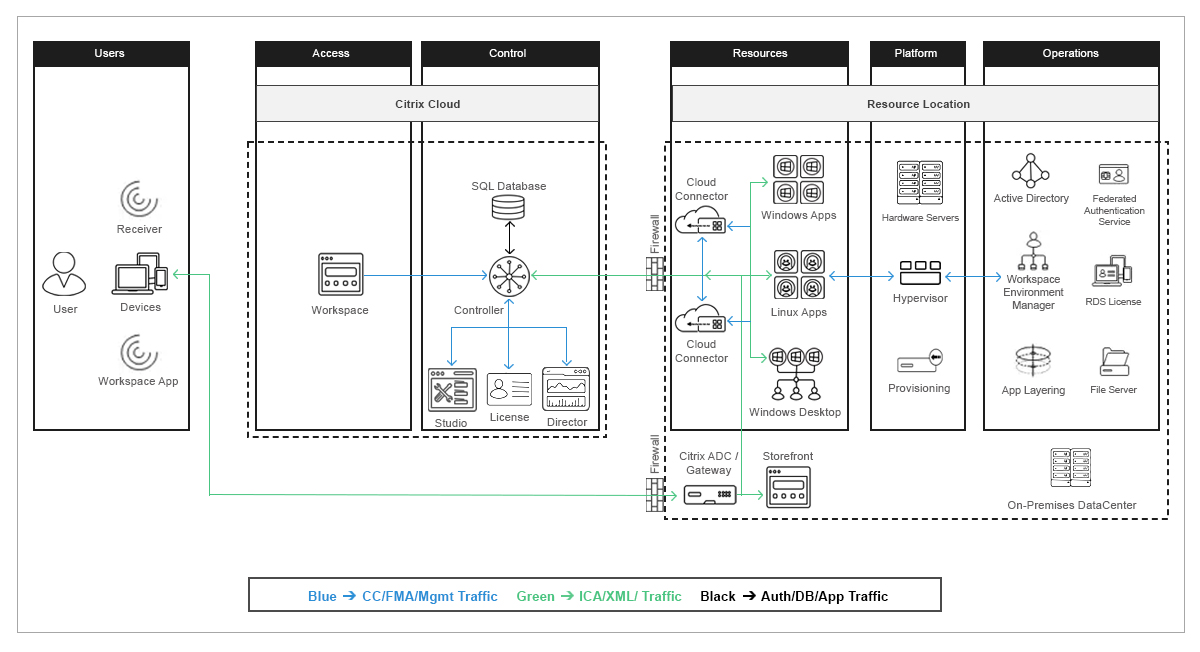
This is why organisations often leverage 2-3, or even more different monitoring products. Unfortunately, this causes different problems. For example, the Citrix team will not have access to the product which the network team uses because they wouldn’t often understand how to interpret the output, and whilst this isn’t a big issue it can increase the amount of time taken to find the root cause of Citrix latency compared to using a single tool which monitors the complete picture.
How eG Enterprise Helps Citrix Admins
eG Enterprise from eG Innovations was one of the first purpose-built tools for Citrix infrastructures. Recognizing the limitations of traditional monitoring tools for Citrix deployments, eG Enterprise includes a number of capabilities that greatly simplify the monitoring and management of Citrix deployments. You can see case studies of how eG Enterprise is deployed by clients here.
With eG Enterprise monitoring for Citrix, you can:
- Simulate user logons from one or more locations and track the performance of Citrix logons 24×7
- Simulate full user sessions including user accesses to applications within a Citrix session and benchmark user experience from different locations. You can also proactively learn about any issues impacting the entire service delivery chain.
- Monitor all of the Citrix tiers from a single pane of glass. The Citrix stack lacks a single console from where you can monitor all of Citrix’s products.
- Monitor all of the supporting infrastructure – Azure, Active Directory, virtualization, storage, firewalls, etc. from the same console, so you have a complete view of the Citrix deployment.
- Get color-coded topology views of the Citrix service, so you can quickly determine where performance bottlenecks may lie.
- View out of the box reports that provide admins with an easy way to view and analyze the historical performance of their Citrix deployments.
To learn more visit https://www.eginnovations.com/.
eG Enterprise is an Observability solution for Modern IT. Monitor digital workspaces,
web applications, SaaS services, cloud and containers from a single pane of glass.
Conclusion
Latency is often talked about in the context of web applications. Citrix applications are far more sensitive to latency than web applications. After all, Citrix accesses are highly interactive and even a slight delay can cause a screen freeze or a session disconnect. Care must be taken when architecting the infrastructure to minimize latency. At the same time, proactive monitoring can go a long way to resolving problems quickly and improving user perception of Citrix latencies.
eG Enterprise is an Observability solution for Modern IT. Monitor digital workspaces,
web applications, SaaS services, cloud and containers from a single pane of glass.
