As an SRE and DevOps evangelist, I talk to many customers and prospects, most of whom run load and stress testing as part of their application delivery chain, often using JMeter for load testing. Many of them have a misconception:
Where you could fall short by solely relying on JMeter for load testing
Take a look at a typical JMeter load testing report (I’ve included some screenshots below).
You will get graph after graph of metrics such as response time, requests per second, error rates, CPU utilization, disk IO, throughput, etc.
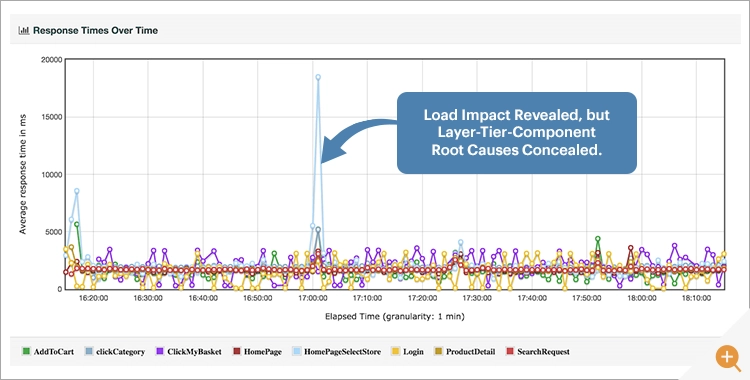
However, JMeter metrics fall short in pinpointing the exact layer, tier or component(s) that may be causing performance issues in a full-stack application.
As an SRE, you need an X-ray into pinpointing system bottlenecks to answer the question:
In this article, we’ll look at:
- What a typical JMeter report looks like,
- Performance insights you may be missing by relying solely on JMeter for load testing
- How APM tools can close this visibility gap
For clarity, I’ll assume that the system-under-test is a Java microservices application undergoing load testing using JMeter.
What is JMeter?
Apache JMeter is a versatile and feature-rich load testing tool that offers many benefits for load testing enterprise applications:
- Suitable for testing high-traffic applications with heavy concurrent user loads.
- Portability and compatibility: JMeter is written in Java and can be run on any platform that supports Java, making it highly portable. It also supports various protocols, such as HTTP, HTTPS, XML, SOAP, and FTP, making it compatible with a wide range of applications.
- Reduced scripting efforts: JMeter provides a user-friendly graphical interface for creating test plans, which reduces the need for scripting.
- Simple charts and graphs for analyzing load-related statistics: JMeter provides various built-in listeners that generate simple charts and graphs for analyzing key load-related statistics, such as response time, throughput, error rates, and resource usage monitors. This makes it easy to flag performance bottlenecks.
What does JMeter capture for load testing?
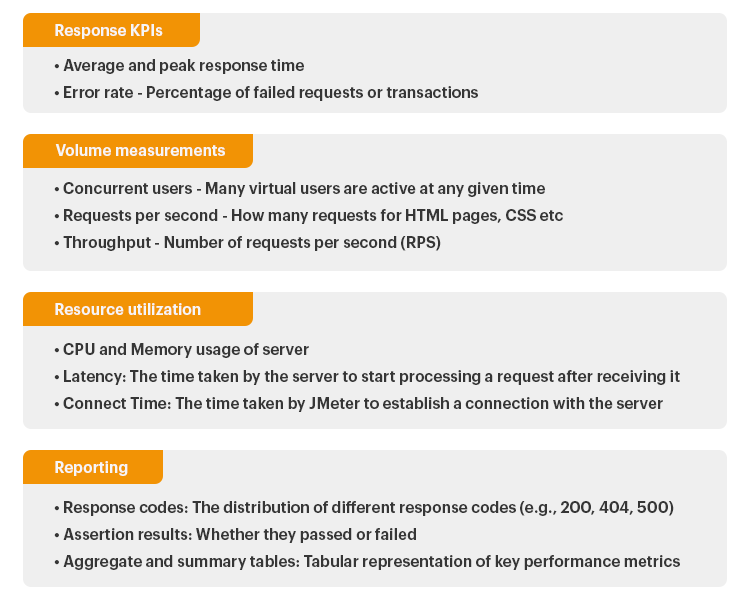
A typical JMeter report provides various performance metrics and statistics for the load test executed. It may include the following information:
RESPONSE KPIs
- Response Time: The average, minimum, maximum, and median response times of the requests sent during the load test.
- Error Rate: The percentage of failed requests or transactions during the load test.
VOLUME KPIs
- Throughput: The number of requests per second (RPS) or transactions per second (TPS) processed by the system under test.
- Hits per Second: The number of hits (requests) per second received by the server.
- Concurrent users
RESOURCE UTILIZATION
- CPU and Memory Usage: The CPU and memory utilization of the server during the load test.
- Latency: The time taken by the server to start processing a request after receiving it.
- Connect Time: The time taken by JMeter to establish a connection with the server.
ADDITIONAL REPORTS
- Response Codes: The distribution of different response codes (e.g., 200, 404, 500) received from the server.
- Assertion Results: The results of assertions applied during the load test, indicating whether they passed or failed.
- Aggregate and Summary Tables: Tabular representation of key performance metrics for each request, including average, median, and percentile values.
Here’s a visual of the above metrics for easy reading.

JMeter provides performance reports from an “outside-in” perspective, but to fully understand the root causes of performance issues, you need an X-ray into the system internals.
A deeper dive into load testing reports in JMeter
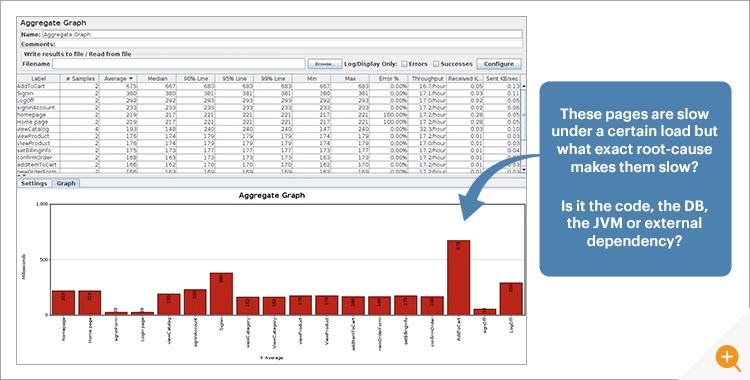
Let us look at the typical aggregate graph report in JMeter.
Varied Root Causes – A typical JMeter report does not pinpoint why different pages are slow. Is it inefficient code, poorly tuned database, JVM bottlenecks, or slow external dependencies?
The above report in JMeter may show that certain web pages are slow under a certain load. Where it falls short is in pinpointing the exact root cause of the performance issues.
Pinpoint performance bottlenecks when load testing
Different web pages could be slow due to a variety of reasons. These bottlenecks could lurk anywhere in your system. Common root causes you will need to eliminate when investigating load testing issues include:
Code
- Inefficient frontend code (example, React or Angular suboptimal rendering)
- Inefficient server-side code (Java thread deadlocks)
Database
- Suboptimal SQL queries
- Poorly tuned database engine
Application Infra
- JVM bottlenecks (garbage collection, leaks)
- App server bottlenecks (connection pools, worker threads)
- Slow external dependencies
OS / Infra
- Network issues such as faulty NIC card or improper routing rules
- Suboptimal infrastructure (OS, VM, containers)
- Docker containers and Kubernetes orchestration
- … and many more.
JMeter struggles to pinpoint the exact layer and tier across the many root-causes listed above.
Filling the key visibility gaps with load-testing: Where should I look next?
Load testing tools are essential for simulating high levels of user activity on a system. Load test reports will show you whether there is a performance or scaling problem.
As the load increases, web applications often slow down, but JMeter lacks the ability to pinpoint the specific layer, tier, or component that caused the slowdown. JMeter is great at simulating load, but falls short in root cause analysis and detailed diagnostics.
JMeter usually falls short in telling you where to look next to solve the root-cause of the performance or scaling bottleneck.
There’s another danger facing the SRE. Without knowing the root cause, executive teams may suggest throwing more hardware at the problem or blame the developers for slow application performance. Without pinpointed root-causes, discussions can often turn toxic under pressure or stress to resolve the issue.
As a result, these reports often end up being disregarded because they fail to provide actionable insights at the code, JVM, application server, infrastructure layers – rendering the effort and expense invested in load testing futile.
How JMeter lacks sophisticated instrumentation capabilities across the full-stack
JMeter lacks instrumentation capabilities to provide detailed insights into the specific reasons behind the performance bottlenecks. To identify the exact root cause, additional investigation using other tools or techniques may be required, such as analyzing application logs, profiling the code or monitoring the database performance using other tools.
JMeter does not know about or understand:
- JVM hops – i.e., tag-and-follow distributed tracing
- Dependencies such as JVMs, JMS queues or external web service dependencies
- Browser instrumentation such as real user monitoring
- Relationships between layers or tiers – correlation is not possible in JMeter
In contrast, a full-stack Application Performance Monitoring (APM) solution can correlate across all layers and tiers and surface the performance bottleneck within minutes.
Conclusion: APM + JMeter = Better together when troubleshooting load testing issues
APM tools offer comprehensive monitoring and analysis of an application’s performance, including code-level insights, transaction tracing, JVM monitoring, error tracking, and more, which can help identify the root causes of performance issues, optimize the application stack configuration, and improve overall application performance.
As an SRE, you can gain a holistic understanding of your application’s performance, scalability, and reliability by combining load testing tools and APM tools. Take targeted corrective actions to ensure optimal application performance even under high user loads.
Like all tools, JMeter has its limitations (and benefits). JMeter is a widely used and powerful tool for load testing. However, one of the areas where it may fall short is in providing detailed root cause analysis and diagnostics.
I hope this article gives you, the SRE, food for thought on the tooling capabilities you need to get a comprehensive understanding of your application’s performance and address any bottlenecks or issues that may arise.
eG Enterprise is an Observability solution for Modern IT. Monitor digital workspaces,
web applications, SaaS services, cloud and containers from a single pane of glass.
eG Enterprise is an Observability solution for Modern IT. Monitor digital workspaces,
web applications, SaaS services, cloud and containers from a single pane of glass.
Learn More
- Find out more about JVM monitoring, see: JVM Monitoring Tools – Threads, GC, Memory Leaks & more (eginnovations.com) and JVM Performance Monitoring Metrics | eG Innovations
- Troubleshooting Java applications? This is a must read: Top Java Performance Problems & How to Fix them | eG Innovations
- If you suspect Java memory leaks, beyond load testing, you might like to explore other testing strategies (such as soak tests) and considerations, see: Java Memory Leak: 7 Myths that SREs Need to Know (eginnovations.com)
- Other load testing tool options beyond JMeter are listed in: IT Infrastructure Management – Tools and Strategies (eginnovations.com)


 Arun is Head of Products, Container & Cloud Performance Monitoring at eG Innovations. Over a 20+ year career, Arun has worked in roles including development, architecture and ops across multiple verticals such as banking, e-commerce and telco. An early adopter of APM products since the mid 2000s, his focus has predominantly been on performance tuning and monitoring of large-scale distributed applications.

