Just a quick blog to let you know our new whitepaper “How to Get Full-Stack Visibility for Your Java Applications” is now available, download it here: How to Get Full-Stack Visibility for Your Java Applications | White Paper (eginnovations.com).
Java is Popular
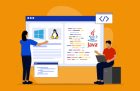
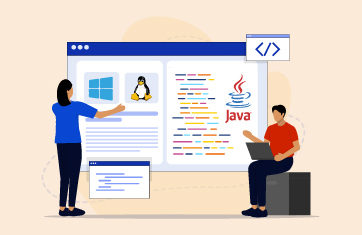
![]() Java is one of the most popular technologies for application development. In a recent eG Innovations and DevOps Institute survey of Application Performance Management in the new normal, almost 60% of respondents reported that they were using Java technologies for their key business applications. Java technology powers key business applications in various domains like finance, healthcare, insurance and education, and many of these applications process tens of millions of requests per day. When these applications slow down, they affect the user experience and in turn, impact business revenue.
Java is one of the most popular technologies for application development. In a recent eG Innovations and DevOps Institute survey of Application Performance Management in the new normal, almost 60% of respondents reported that they were using Java technologies for their key business applications. Java technology powers key business applications in various domains like finance, healthcare, insurance and education, and many of these applications process tens of millions of requests per day. When these applications slow down, they affect the user experience and in turn, impact business revenue.
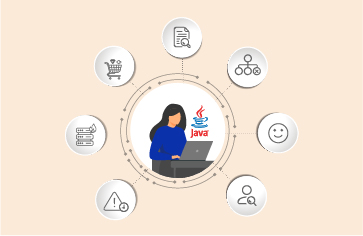
If you are running Java applications in production, you’ve almost certainly encountered scenarios where the application freezes and slows down, or it takes a large amount of CPU. You are left wondering where the problem lies, and who to contact to resolve the issue. The whitepaper is intended for anyone running Java applications who needs to differentiate between problems with infrastructure (is it a CPU/RAM limitation on a server), JVM and Application Server issues and code-level issues in Java such as memory leaks.
Java Troubleshooting with Full-stack Visibility
This new whitepaper covers three key areas that Java application performance monitoring solutions must focus on to provide visibility into the root-cause of slowness. You’ll learn how to monitor and troubleshoot the full Java stack – what metrics, traces and logs to leverage and how to do so. We cover in-depth:
- JVM (Java Virtual Machine) Monitoring
- Thread level monitoring
- Tracking garbage collection activity in the JVM
- Proactively detecting memory leaks in application code
- Java Application Server Monitoring
- Java Application Code Monitoring and Diagnostics
The whitepaper also describes tag-and-follow distributed tracing technologies and how they can highlight Java code issues. You’ll learn about:
- How to get code level visibility without the need to modify Java applications
- Debug techniques suitable for IT Operations and Infrastructure teams who are not Java developers
- Monitoring logs for total observability of Java technologies
- How industry standard techniques such as byte-code instrumentation work
- How to monitoring, troubleshoot and optimize multi-tiered services and apps where user satisfaction relies on multiple JVMs and applications
- How to gain the same visibility if your Java apps also depend on Microsoft .NET, Microsoft .NET Core, Node.js or PHP components
- What “Converged application and infrastructure monitoring” is and how to implement it

Get up to speed with the latest best practices for Java application delivery, today: How to Get Full-Stack Visibility for Your Java Applications | White Paper (eginnovations.com)
eG Enterprise is an Observability solution for Modern IT. Monitor digital workspaces,
web applications, SaaS services, cloud and containers from a single pane of glass.
Learn More
- We’ve put together what we think are the top myths around Java Memory usage – how many of them have you encountered? Would you have chosen the same problems as our author, see Java Memory Leak: 7 Myths that SREs Need to Know (eginnovations.com) ?
- If you are using JMeter to test your Java Applications, learn how to overcome some limitations you may have encountered, here: How APM Solutions Enhance JMeter Load Testing Visibility (eginnovations.com).
- Overview of Java Application Performance Monitoring (APM) solutions from eG Innovations – Java Application Monitoring | eG Innovations.
- For a list of Java Application Servers that eG Enterprise supports, please see: End-to-End Monitoring: Applications, Cloud, Containers (eginnovations.com), select “Java Application Servers” in the “Category by” drop-down to get an up-to-date list.
 Keegan is a Sales Manager based in our Singapore office. Keegan has built-up a wealth of knowledge and experience on all aspects of application and infrastructure monitoring in his 14 years at eG Innovations. Keegan joined eG Innovations and enrolled in a part-time BSc programme at the University of Manchester in the UK. He works closely with many of our other APAC teams across the region.