Administrators and IT management are increasingly leveraging simple quantifiable KPI indicators such as “Performance Ratings” to gain rapid overviews and track key outcomes.
Modern IT architectures are designed and built to scale and be resilient. Systems are now usually built to handle failover and auto-scale up and down to handle varying demand and workloads with very different properties and needs. Redundancy and surge capacity is often built-in to systems by design, as is self-repair.
Modern technologies such as containers, microservices and cloud services mean IT systems are distributed and often administrators handle 100s or 1000s of servers, VMs and users. Modern monitoring platforms also allow alert automation, whereby thresholds can be set on 1000s or even millions of individual metrics. This can lead to alert fatigue and alert storms with administrators being swamped by hundreds of alerts and messages regarding minor and even inconsequential events.
Performance Ratings and User Experience Scores provide a way to aggregate the signals from multiple metrics to get a useful measurable for the health of components and help eliminate alarm storms.
What is a Performance Rating?
Performance Ratings enable the grouping of different measures for a single component, service or user. A single quantifiable rating/index that is representative of multiple metrics. Comparable to an Apdex (Application Performance Index) score or rating or a Customer Satisfaction Index (CSI) calculated by service providers. A very common application is for generating a “User Experience Score”, “Experience Score” or “UX Score”. A single number that measures how good the performance of a service or an experience is. Other names and terms describing performance ratings include “health score”, “health rating”, “stress level” and so on.
Performance Ratings – Example: VDI and DaaS user experience scores
Monitoring tools and observability tools can collect hundreds of metrics, events and signals associated with the VDI user experience. Many of these metrics are interdependent and many remoting protocols dynamically adapt to compensate for resource constraints e.g., reducing frame rate (fps) count to reduce bandwidth needs or reducing frame quality to lower CPU encode/decode demands.
Consider the user experience metrics typically exposed for Citrix CVAD (Citrix Virtual Apps and Desktops) which include Application launch time, ICA / HDX latency, logon time, enumeration time, network latency, profile load time, user input delay and more – plus the associated session and resource metrics such as CPU and RAM usage. Whilst the details are essential for troubleshooting. No single one of these metrics is suitable as a performance rating.
A meaningful comprehensive user-experience metric needs to enable administrators and IT management to:
- Compare the user experience of one session to another
- Allow the reporting and tracking of user experience over a period of time
- Be a quantifiable measurable KPI that can be used to state if the experience has been consistent, degraded, or improved
- Allow admins to segment users and focus on those users have or are having a frustrating experience with applications
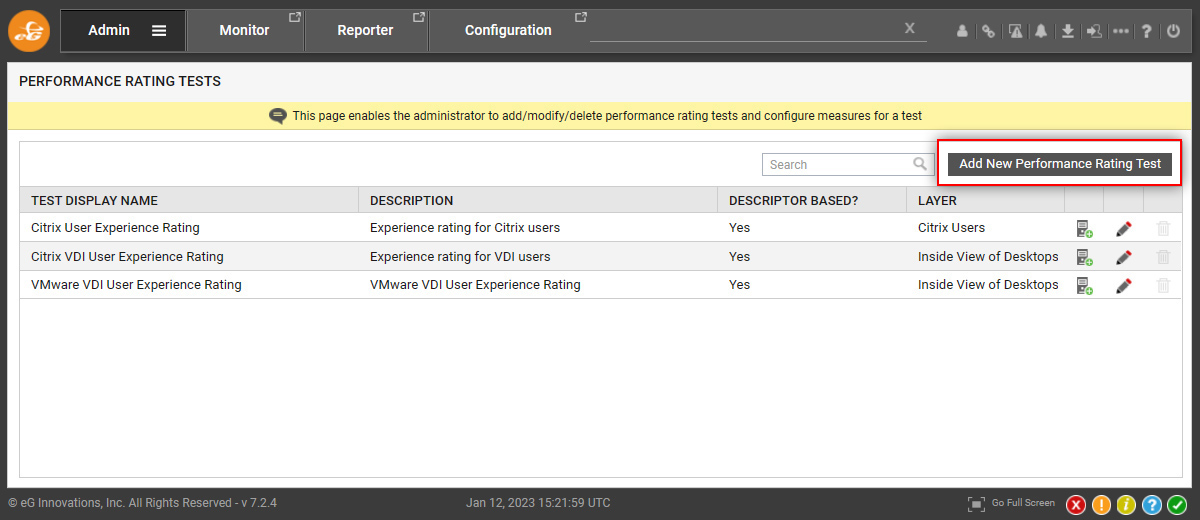
eG Enterprise includes out of the box performance ratings for user experience that can be used as a significant metric for measuring, reporting, and comparing user experiences, including:
- Citrix User Experience Rating (for Citrix virtual apps)
- Citrix XenApp User Experience Rating (for Citrix XenApp 6.5)
- VDI User Experience Rating (for Citrix VDI)
Details on how to enable the out-of-the-box ratings are covered in the eG Enterprise documentation, see: Performance Rating Tests (eginnovations.com).
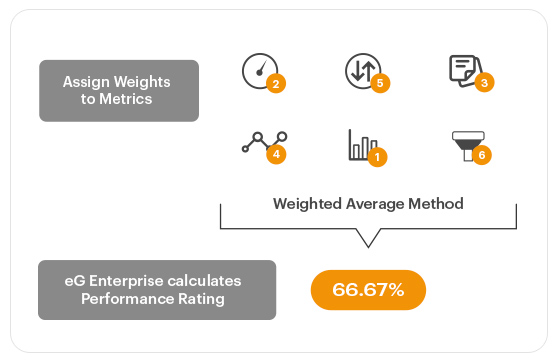
eG Enterprise also supports custom performance ratings that allow customers to build and tune their own measures based on multiple metrics and weight them accordingly.
Performance Ratings can be defined for any of the 500+ technology stacks that eG Enterprise supports across a wide range of use cases from user experience for web applications, cloud deployments and DaaS / digital workspaces such as Citrix, Microsoft AVD / Windows Cloud PCs and VMware, to “Stress Level” measures for system or network resources.
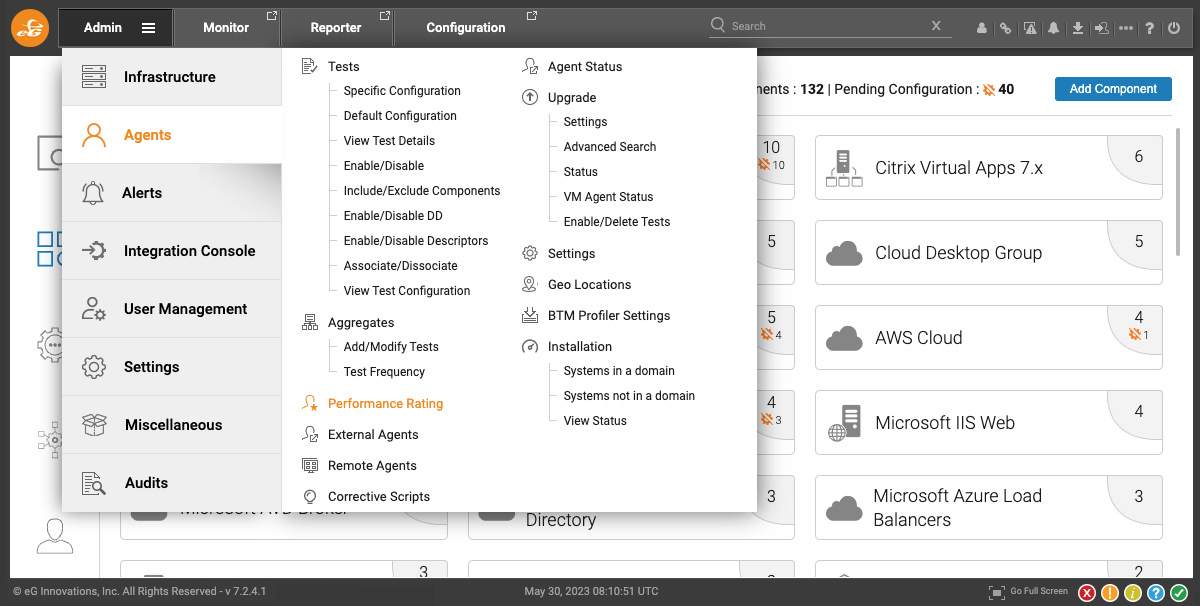
Admin -> Agents-> Performance Ratings
The benefits of performance ratings and user experience scores
Having a single number associated with a component such as a server, user session experience, a web service or similar condition means that there is a single quantifiable number allowing an admin to:
- Assess health instantly at-a-glance without reviewing dozens of interdependent metrics
- Use intelligent thresholds and alerting around a single value based on multiple metrics to avoid alarm fatigue
- Gain instant visibility overviews. In eG Enterprise performance ratings such as Citrix User Experience or custom Performance Ratings can be included on dashboards to give a rapid overview of service levels and user satisfaction
- Improve visibility for the wider organization. As a measure, performance ratings can be used with thresholds applied to automatically generate reports
Detailed metrics are needed for performance experts when investigating specific issues and support incidents, however IT executives should not have to go through all of these to know and assess whether the user experience is good/not and whether the average user experience is degraded or acceptable long term.
Evaluating the capabilities of performance ratings
Many monitoring and AIOps Observability platforms offer some sort of performance rating measurements, sometimes only pre-defined out of the box, but some allow some level of configuration and a few (including eG Enterprise) also offer the ability to build full blown custom performance ratings. Sometimes these ratings are called “UX Score” or “User Experience Score”, sometimes simply just “Experience Score” or “Stress Level” or similar according to proprietary branding and whether applied to a user session or a server / networking component.
When evaluating performance rating functionality and capabilities, you will probably want to evaluate:
- What type of thresholds can you set on the rating to trigger alerts?
- Are both static and dynamic thresholds available to minimize noise and ensure intelligent anomaly detection / normal usage for time-of-day accounted for? Dynamic thresholds are particularly important when using aggregated metrics as they are particularly difficult to manually calculate.
- How is the rating displayed and consumed by overview dashboards?
- Can you easily trigger reports off the rating?
- What performance ratings are available out-of-the-box?
- Is there a GUI to build custom performance ratings?
- Can you integrate alerts from performance ratings into your organization’s other ITSM systems (e.g. helpdesk tools such as ServiceNow or Freshdesk) and analytics systems (PowerBI etc.) as desired?
Performance Ratings vs. Metric Aggregation
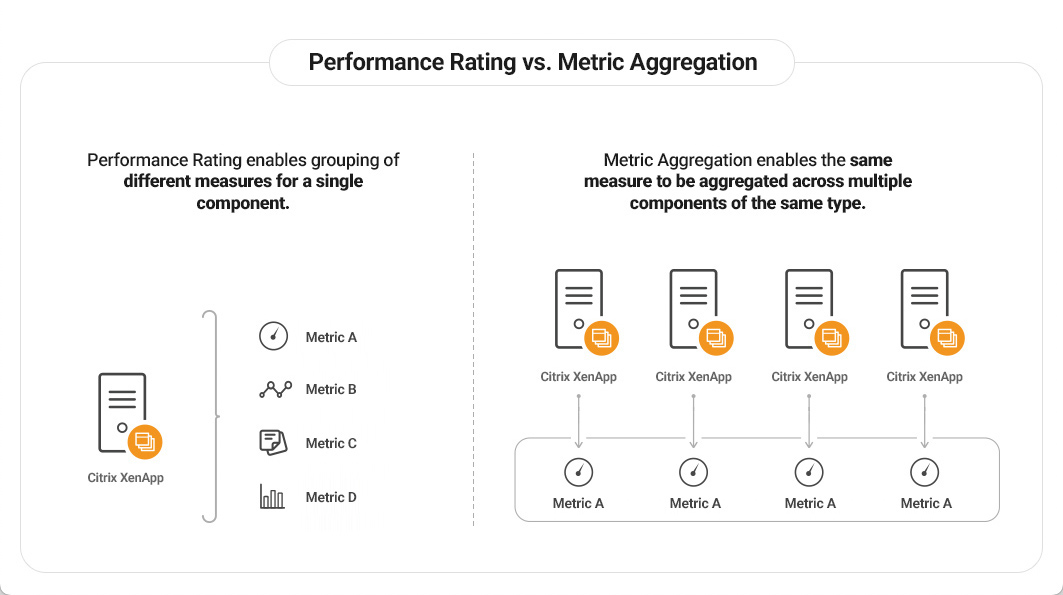
In a future blog I hope to also cover eG Enterprise’s Metric Aggregation capabilities. For some use cases Metric Aggregation may be a more appropriate feature to leverage. For now, bear in mind that a Performance Rating enables grouping of different measures for a single component. Whilst Metric Aggregation enables the same measure to be aggregated across multiple components of the same type.
eG Enterprise is an Observability solution for Modern IT. Monitor digital workspaces,
web applications, SaaS services, cloud and containers from a single pane of glass.
eG Enterprise is an Observability solution for Modern IT. Monitor digital workspaces,
web applications, SaaS services, cloud and containers from a single pane of glass.
Learn More
- The eG Enterprise Performance Rating Documentation: Performance Rating Tests (eginnovations.com)
- Read about User Experience Monitoring Tools for Great Digital Experience
- Citrix User Experience Monitoring – Best Approach White Paper (eginnovations.com)