Single Console for Applications & Infrastructure.
eG Enterprise is an end-to-end IT performance monitoring solution that supports over 500+ different technologies.
It consolidates your disparate, siloed monitoring tools into a single pane of glass to get you to the root-cause of performance problems quicker.
Role-based access control means everyone on the team can monitor their area of responsibility and create customized dashboards unique to their requirements.
When problems arise, eG Enterprise has already mapped your interdependencies and automatically correlates application and infrastructure performance to pin-point the root-cause.
Deliver the ultimate end-user experience by proactively addressing virtual application and desktop performance issues before your employees notice.
Citrix Monitoring
Citrix Cloud Monitoring
VMware Horizon Monitoring
AVD Monitoring
Amazon WorkSpaces Monitoring
Amazon AppStream Monitoring
Microsoft RDS Monitoring
IGEL Monitoring
VDI Monitoring
Nerdio Integration
Deliver high performance applications that are deployed on the cloud, on-premises or in hybrid, multi-cloud environments.
Java APM
.NET Monitoring
PHP APM
Node.js APM
Consolidate your public cloud monitoring into a single dashboard and correlate the root-cause of problems even for hybrid or multi-cloud deployments.
AWS Monitoring
Azure Monitoring
Alibaba Monitoring
Full visibility into orchestration, worker nodes, containers, application running on them and the underlying infrastructure.
Red Hat OpenShift Monitoring
Kubernetes Monitoring
Docker Monitoring
Unified console for monitoring virtual platforms which analyzes virtualization performance within the context of the business services that it supports.
VMware ESX Monitoring
Hyper-V Monitoring
Nutanix AHV Monitoring
RHEV Monitoring
Solaris LDoms Monitoring
Oracle VM Monitoring
Citrix Hypervisor Monitoring
Track performance and usage by web sites and transactions, error URLs, traffic, queues, slow requests and more in a single console.
Microsoft IIS Monitoring
Apache Monitoring
Nginx Monitoring
Monitor all aspects of application server performance: JVM, web containers, application transactions and more.
Tomcat Monitoring
WebLogic Monitoring
WebSphere Monitoring
JBoss Monitoring
SAP NetWeaver AS Monitoring
JEUS Monitoring
Jetty Monitoring
Track all key performance indicators of server performance from a central web console and get proactive alerts.
Windows Server Monitoring
Linux Server Monitoring
Solaris Server monitoring
HP-UX Server Monitoring
IBM AIX Server Monitoring
Server Hardware Monitoring
Get visibility into all aspects of database performance - workload, configuration, memory buffers, I/O operations, queries, and deadlocks.
SQL Server Monitoring
Oracle Database Monitoring
MySQL Monitoring
Sybase Monitoring
MongoDB Monitoring
MariaDB Monitoring
PostgreSQL Monitoring
SAP HANA Monitoring
IBM DB2 Monitoring
Azure SQL Monitoring
Snowflake Monitoring
Redis Monitoring
Aurora Database Monitoring
DynamoDB Monitoring
Monitor network, server, storage, cloud, containers and more. AIOps-powered insights make monitoring and diagnosis easy.
Active Directory Monitoring
Azure AD Monitoring
Network Monitoring
Storage Monitoring
Citrix ADC Monitoring
Message Queue Monitoring
Get in-depth insights and proactively monitor and troubleshoot a wide spectrum of enterprise applications and SaaS services.
Office 365 Monitoring
SharePoint Monitoring
Microsoft Exchange Monitoring
SAP Monitoring
PeopleSoft Monitoring
AllScripts Monitoring
Moodle Monitoring
Cerner Monitoring
Microsoft Monitoring
Red Hat Monitoring
eG Innovations offers specialized IT performance monitoring for a range of industries to help IT teams deliver what their businesses expect of them.
Healthcare
Education
Government
Banking & Finance
Credit Unions
Manufacturing
Retail
MSPs
Find out why eG Enterprise is a popular choice for Managed Service Providers (MSPs)
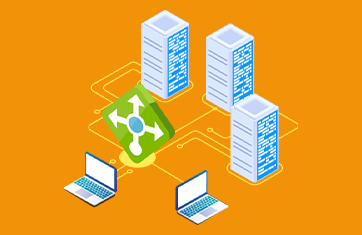
 monitoring and troubleshooting Azure Virtual Desktop (AVD).
A brief overview of the most popular relational and non-relational database cloud service options available on Microsoft Azure.
Learn about troubleshooting AVD connection failures and problems. Understand how AVD connections work and how to identify common causes of issues and resolve them.
What is RDP Shortpath? How does RDP Shortpath work? Everything you need to know to get started and troubleshoot RDP Shortpath connections for AVD.
Learn how to traceably manage maintenance activities by muting and suppressing alerting. You can continue to monitor your components under maintenance and preserve a full metric history but avoid alert storms impacting ticketing systems or dashboards.
Learn about how to ensure monitoring tools are resilient to cloud outages and other issues and how to ensure you have complete visibility on cloud outages and resilient notification processes to end-users.
Learn how proactive monitoring of Azure services can detect Microsoft Azure outages impacting key services such as Office 365 / M365, Outlook, Teams and AVD to ensure help desks have early warning and avoid support tickets from large numbers of users.
Learn how proactive monitoring of key metrics on Azure Load Balancers can instantly alert you to issues and avoid performance or availability issues impacting your critical services and end users’ experience.
When applications suffer performance degradation often the root cause of the issue is a database problem. In this guide we’ll show you 7 ways to troubleshoot your Azure SQL database performance issues using metrics and insights from the eG Enterprise monitoring solution...
When should you choose to deploy SQL Server on Azure VM rather than use Azure services such as Azure SQL Managed Instance or Azure SQL Database? This article should help you make the choice.
Windows 365 is a cloud-based service from Microsoft that is being embraced increasingly. Learn why you should and how you can monitor your users’ Cloud PCs and the digital employee experience end-to-end.
What is the AVD Broker and what does it do? How does it fit into an AVD Deployment and how does it affect user logon experience? Learn about which key metrics, events and alerts you need to monitor for total insight and what thresholds and alerts should be configured for the AVD Broker