

A new era is here, where cloud computing is taking a growing share of the digital workspace market. Microsoft are well placed to capture an increasing part of this market to deliver digital workspaces to end users to run their business applications. Using Azure as the umbrella we see new Microsoft services arise each year. Last year the Windows 365 service was born with a Cloud PC service offering both Business and Enterprise subscriptions.
What is Windows 365?
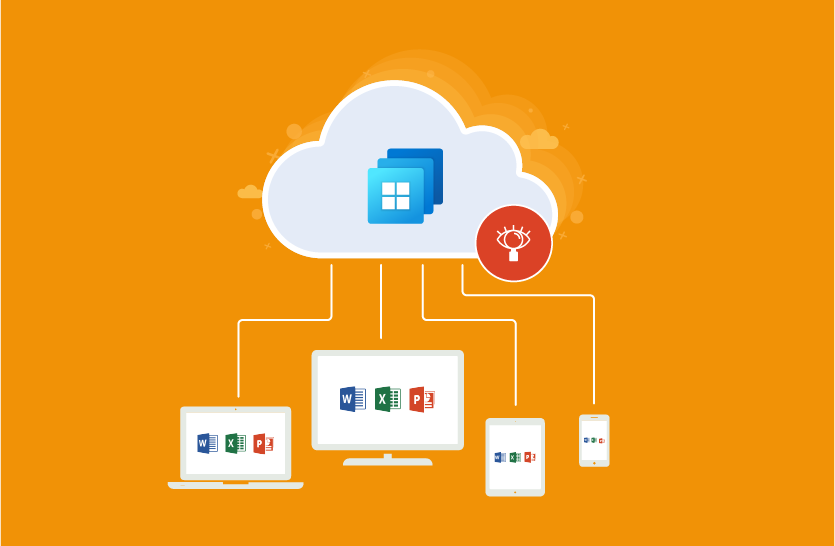
Windows 365 is a cloud-based service from Microsoft that delivers a Windows virtual machine, aka the Cloud PC, to your end users. Windows 365 is available in two editions: Windows 365 Business and Windows 365 Enterprise. Both editions rely on Azure Active Directory (Azure AD) and provide a dedicated Windows device to users for a fixed monthly subscription cost. Microsoft provides a clear overview of the differences. To briefly summarize:
- Windows 365 Business is limited for organizations with a maximum of 300 Cloud PC users, offers less flexibility and by default doesn’t have real management capabilities.
- Windows 365 Enterprise is not capped on seats per tenant, brings more flexibility in network architecture and is fully managed via Microsoft Endpoint Manager.
There are plenty of articles to help you choose whether Windows 365 Cloud PCs or Microsoft AVD (Azure Virtual Desktop) will best suit your needs. Such as: Windows 365 vs. Azure (Windows) Virtual Desktop | Nerdio (getnerdio.com). Today, I’ll focus on understanding Cloud PCs and monitoring them once you have made that decision.
What is a Cloud PC?
As Microsoft perfectly describes “A Cloud PC is a highly available, optimized, and scalable virtual machine providing end users with a rich Windows desktop experience. It’s hosted in the Windows 365 service and is accessible from anywhere, on any device.”

End users have a 1:1 relationship with their Cloud PC. It’s their own personal PC in the cloud. Users can connect to their Cloud PC by using windows365.microsoft.com. Browser and app-based access is available for Windows, Mac, iOS, and Android devices.”
Why Monitor Cloud PCs?
We believe all digital workspaces need to be monitored! How else can you tell if the digital employee experience (DEX) is what you expect and not impacting productivity? And when an end user calls the Service Desk, how would you help the user without having any idea about what is going on at that moment in time, let alone what was going on a week ago? Is the RDP latency high, is the Cloud PC lacking resources or is an application misbehaving? Also, after determining the cause, how would you fix the issue remotely without a tool that can do so.
It is important to realize that a Cloud PC is personal and static (a persistent desktop). Meaning that changes made by your users are not cleared on reboot, and therefore also presents an increased risk of a negative user experience and challenges for the help desk. Increasing the Cloud PC plan – e.g., making more vCPUs available – increases costs and also offers no assurance of user experience improvements. After all, you don’t know what processor clock speed you are taking off, or what if it is a single threaded application process that is impacting performance!
What Windows 365 Endpoint Analytics Can and Cannot Provide?
For Windows 365 Enterprise customers, Microsoft provides Windows 365 Endpoint Analytics as part of the required licenses. Endpoint Analytics is accessible from the Microsoft Endpoint Manager admin center and provides – at the time of writing – six reports to assess the health of the Cloud PCs. The most significant information provided is about device boot and sign-in times, CPU and RAM spikes, Round Trip Time and application reliability. Application reliability is about usage, total crashes last 14 days and active devices last 14 days on a per application perspective. At this time, there is no support for displaying CPU and memory usage information.
You can directly see Endpoint Analytics is not meant as a feature rich monitoring solution. The reports provide ratings without any details on what causes the rating to be high or low. The number of visible measurements is also limited; you can see maximums, averages and a 30 day trend with 1 consolidated measurement per day.
As Endpoint Analytics is not a monitoring solution, critical features such as alerting based on dynamic and static thresholds, ITSM integrations (e.g. to ServiceNow or Autotask) and extensive reporting are not included.
Monitor and Manage Cloud PCs with eG Enterprise
For over two decades, eG Innovations has been a key player when it comes to in-depth monitoring for digital workspaces, initially for on-premises VMware and Citrix technologies. And now, we also support Cloud PCs delivered through the Windows 365 service.
Our eG Enterprise solution provides a user-centric monitoring of the Cloud PCs, including the same dashboarding and reporting capabilities that we also provide for Azure Virtual Desktop. As with all functionality, monitoring support for Windows 365 Cloud PC is available in a self-hosted eG Enterprise setup as well as a SaaS solution. Intuitive GUI views and features specifically designed for non-specialist L1/L2 help desk operators are included and designed to avoid unnecessary and mis-directed escalations to specialist system administrators.
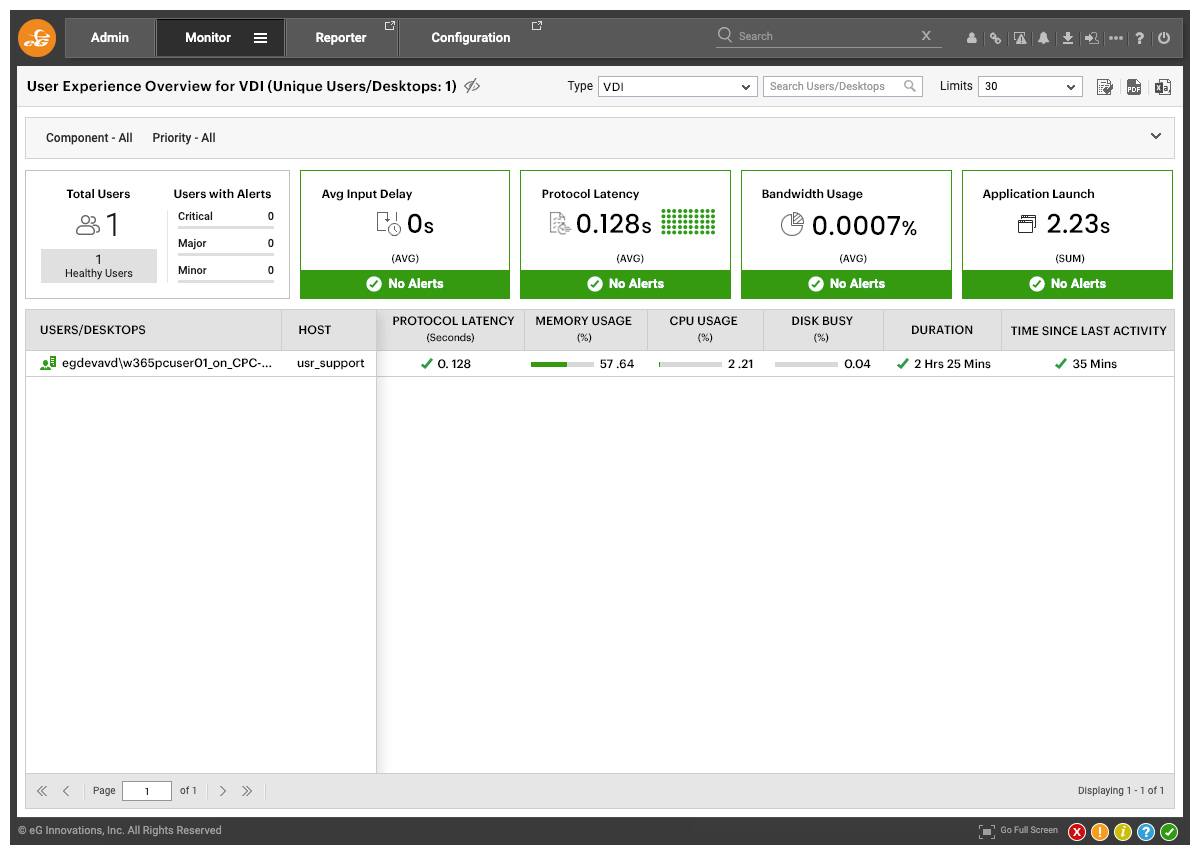
Investigating users often begins in the User Experience Overview. In this view we list, rate and sort all users’ sessions based on KPIs (Key Performance Indicators) to highlight the sessions that require the most attention.
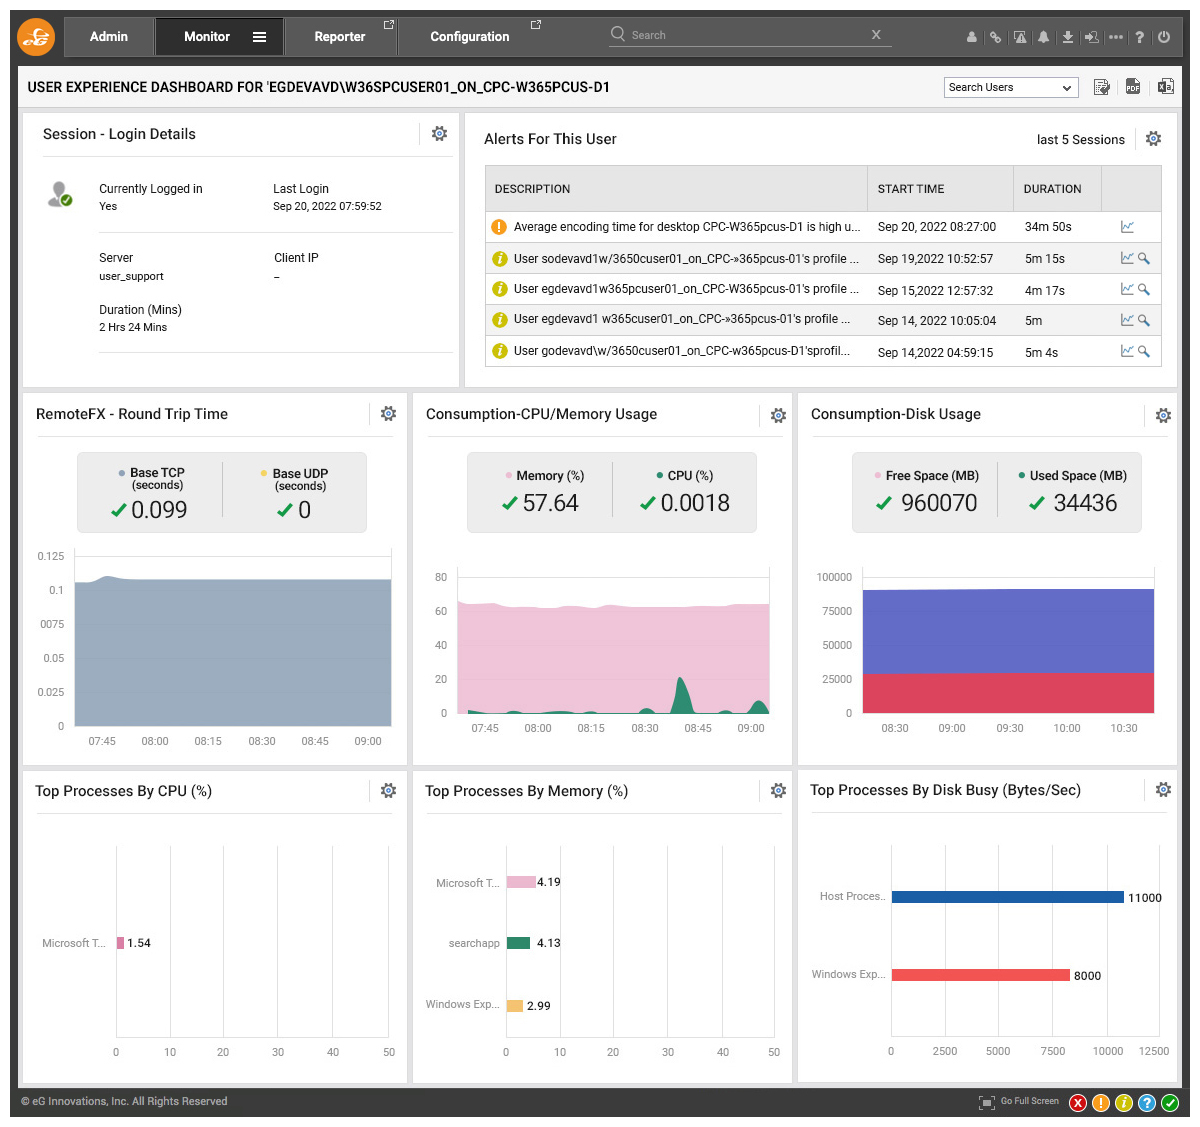
Zooming into a specific user session opens the User Experience Dashboard for that user. This provides IT staff real-time insights in session information, recent alerts for the user, resource consumption from within the Cloud PC, RemoteFX Round Trip Time (RTT) and top processes by CPU, memory and disk activity.
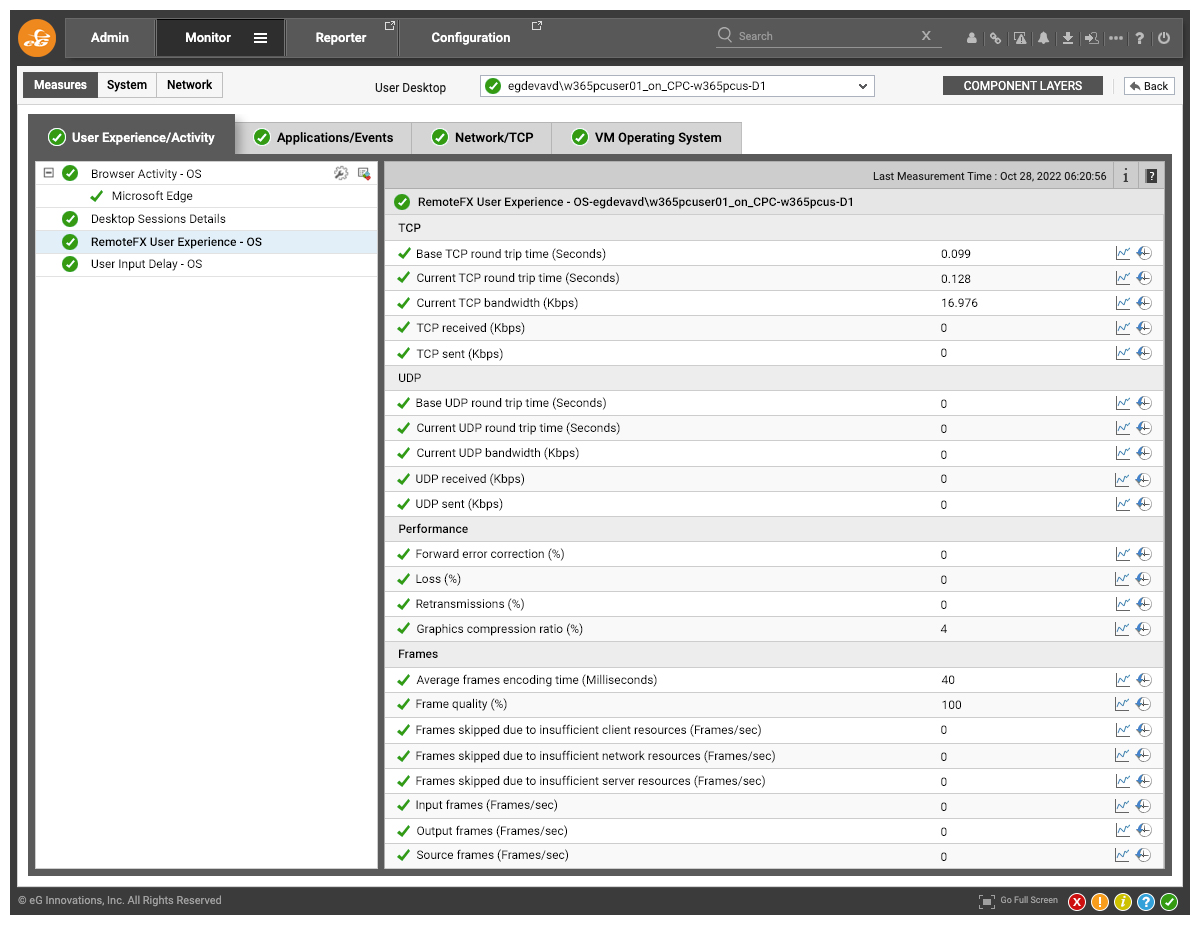
From the User Experience Dashboard, you can browse to get more detailed information. As in this example all relevant metrics of the RDP RemoteFX protocol.
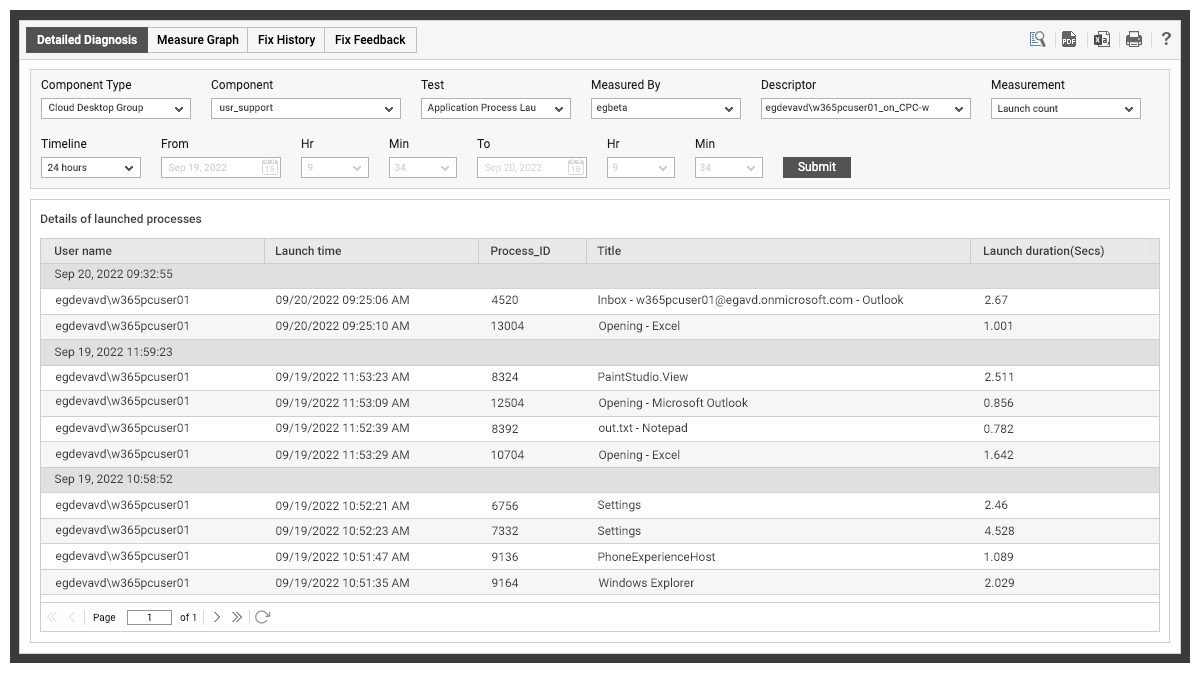
Information on application launch times is also available directly from the monitor console and within the reporting engine. Clicking on the magnifying glass brings up this Detailed Diagnoses dialog, where you can also export the information to PDF- or CSV-format.
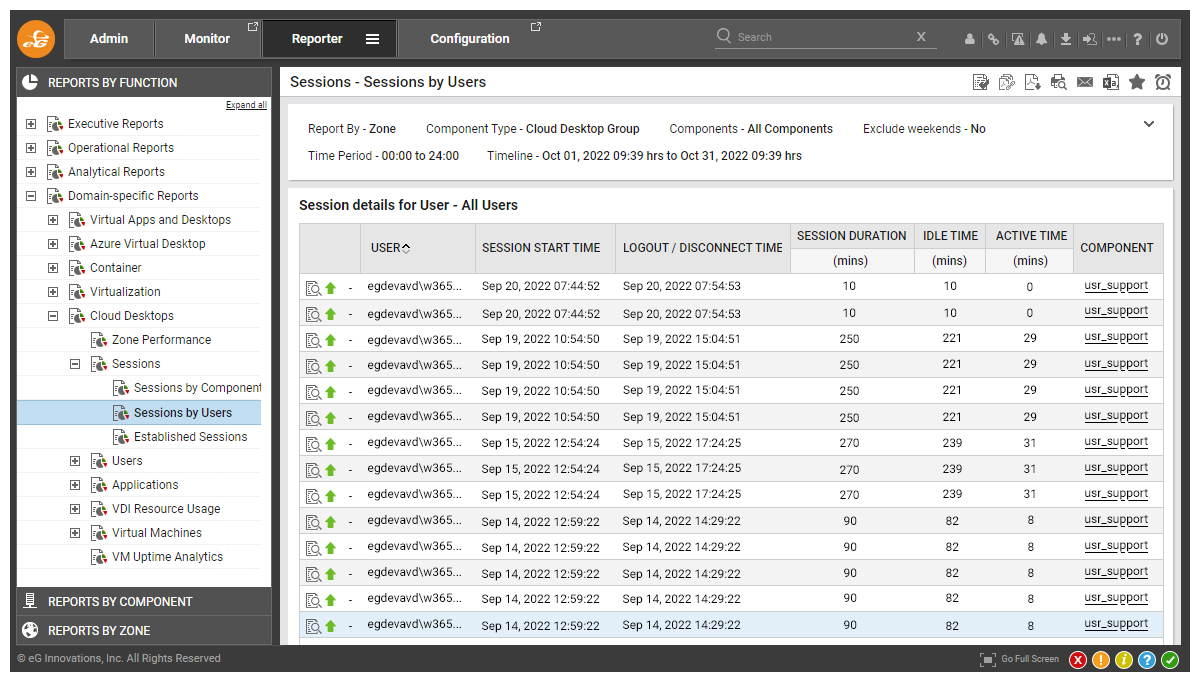
The reporting tab provides many different out-of-the-box reports. These reports help to troubleshoot retrospectively (a doctor can’t usually leave their patients to call in an IT issue immediately), to investigate intermittent issues, to show trends and to feed into management reports to make decisions based on actual information. The Sessions by Users report, for example, shows an overview of all user sessions for a customizable timeline where you can even open a User Experience Dashboard back in time to investigate issues regarding e.g., latency or applications.
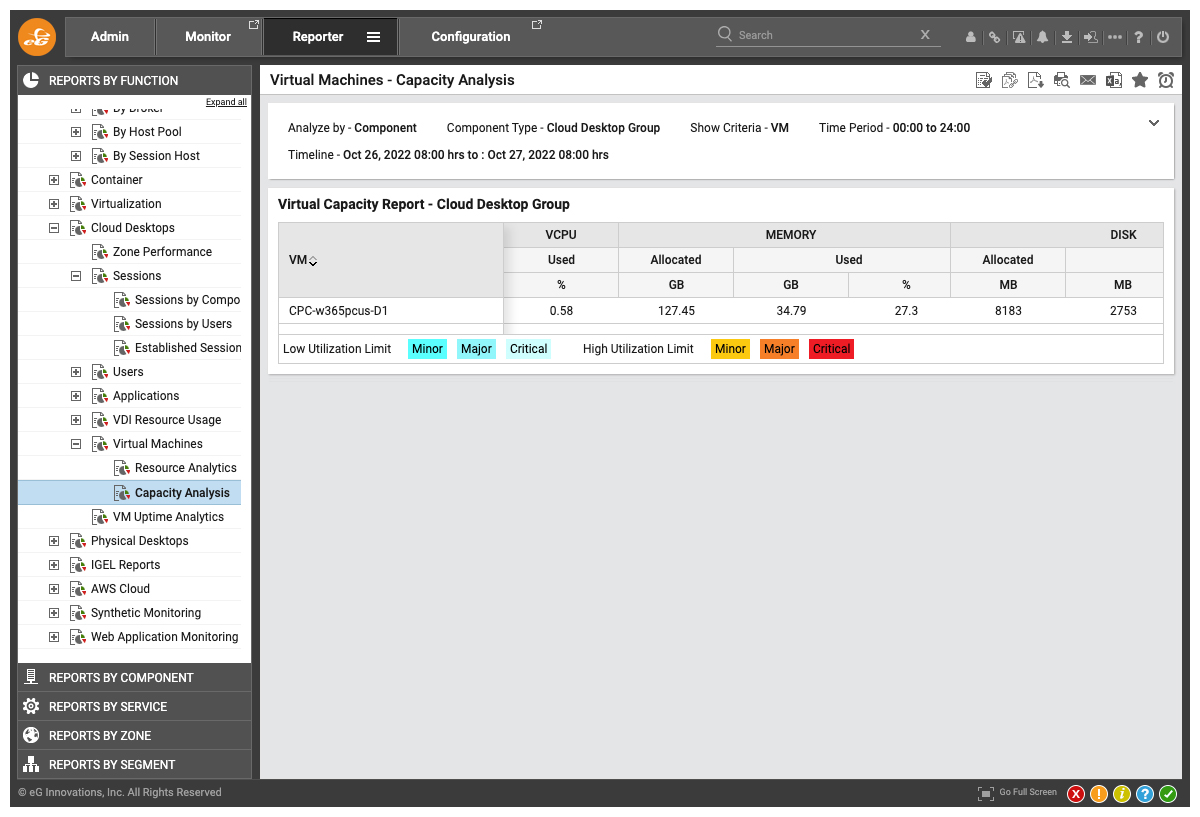
Another example is the Capacity Analysis report that can help decide if assigned resources are sufficient. Of course, I am not suggesting that you should immediately upgrade to a higher Cloud PC plan if this report shows high usage. With eG Enterprise, you can now drill down to really see what is causing the high resource usage and whether it is unnecessary!
Extend Monitoring to your Azure AD, Azure Subscription, Applications and more!
In the end, a digital workspace is intended to be a productivity hub for your end users. So they will be using the browser and installed applications to do their day-to-day working activities.
As indicated above, the Cloud PC is dependent on Azure AD, the browser needs web applications to be running smoothly and the Windows applications depend on (modern) app services or servers running on-premises or in a public cloud.
eG Enterprise is able to monitor them all from only one Console. We monitor Azure AD (and provide auditing retention periods beyond what Microsoft does), we monitor your Azure Subscription(s) (including the Cloud PC’ network interface depending on the Windows 365 design) and we also monitor your applications, servers and PaaS and SaaS services such as Azure SQL DB and Office 365. This way we provide IT teams an end-to-end overview for your Windows 365 Cloud PC IT service!
Citrix HDX Plus for Windows 365
Third-party vendors such as Citrix have announced integrations to add value to Windows 365. Citrix announced Citrix HDX Plus for Windows 365 (currently as of Oct 2022 in public preview) to enable users to benefit from the increased experience of the Citrix HDX protocol and organizations can integrate other identity solutions. eG will monitor the protocol used in the user session for both Microsoft RDP / RemoteFX and Citrix HDX. In addition, eG Enterprise can monitor Citrix Cloud Sites and – if used in the session – the vGPU / GPU (graphical processing unit).
Want to try it out?
The easiest way to test-drive eG Enterprise is by using our managed eG Enterprise SaaS platform (alternative on-premises and self-managed options are available). Follow below 3 steps to be live within the hour:
- Register and install the eG Agent
- Package downloaded eG Cloud Desktop Agent to an Intune package
- Distribute using Microsoft Endpoint Manager
Within an hour you will be able to enjoy all of the above presented dashboards and reports to really see what is going on in your Cloud PC environment!
eG Enterprise is an Observability solution for Modern IT. Monitor digital workspaces,
web applications, SaaS services, cloud and containers from a single pane of glass.
Learn More:
- What is Windows 365? | Microsoft Learn
- Digital Workspaces in the New Normal 2021 Survey Report (eginnovations.com)
- What is Windows 365 and what does it offer? (techtarget.com) covers many of the key differences between Windows 365 and Azure’s AVD (Azure Virtual Desktop) services
- What is Microsoft Azure Virtual Desktop – AVD | eG Innovations
- Azure Cloud Monitoring Tools & Solutions | eG Innovations
- Office 365 Monitoring, Reporting and Performance Management (eginnovations.com)

