Making Help Desk Teams More Productive is a Priority
On one of the EUC slack forums, a question was recently posted asking what are the key lessons learned in the last year and what changes organizations should investigate in the next year.
 The answers were revealing. Several folks pointed out that prior to the pandemic, we were operating within the comfort zone of carefully planned deployments with managed devices and managed networks. Work-from-home at scale and short notice introduced a whole new level of complexity that many organizations were not prepared for.
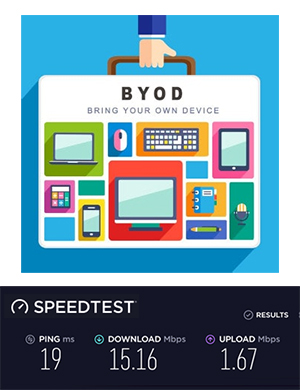
There’s always been a lot of talk about “bring your own device” (BYOD) in the past. Work-from-home accelerated BYOD and added to it BYOB – bring your own bandwidth! When a user called in about poor application performance, there was always the suspicion that the reported issue could be on the user’s end point or in their home network or with their ISP (Internet Service Provider).
The slack discussion then rapidly turned to a discussion on how helpdesk teams can be equipped to do better at triaging problems and getting the right teams involved for resolving a problem. It was widely felt that getting help teams to perform better would help the business.
 The recent Digital Workspace & Performance Monitoring in the New Normal Survey Report of 1000+ IT Professionals from eG Innovations corroborates this discussion, highlighting how help desk teams have not been very effective and how this is having a ripple effect on the domain experts who are having to spend more time troubleshooting routine issues:
- 51% of respondents believed that helpdesk staff are not able to help at least 50% of the time in resolving a digital workspace problem reported by users.
- 47% of respondents spent more than 25% of their workday (i.e., more than 2 hours per day) troubleshooting problems.
The Challenge of Help Desk Teams: Lack of Tools and Visibility
IT operation staff often complain about the ineffectiveness of help desk teams and suggest that they be provided with check lists and decision trees as well as better training to allow them to triage problems quickly and effectively.

Help Desk vs. IT Support
Most commonly, a help desk is a contact point for customers who have questions, issues with IT services, or need help with general tasks.
In contrast, technical support is for troubleshooting technical problems that are usually more time-consuming and complicated.
While training focused on triaging problems will be helpful, the root cause of the issue is the way in which IT operations teams are structured and how monitoring tools are deployed. Most IT teams are also structured as a combination of multiple silos – the networking team, the database team, the Citrix folks, the application teams, and so on. The monitoring tools are also aligned with the IT teams – there are expert tools for the network, the database, for the digital workspace tier, and so on. Many of these tools also provide very detailed insights. Expecting help desk staff to use the same domain-specific tools that the system/domain administrators use is unreasonable and illogical. Most domain-specific tools provide too many detailed metrics and often the interface for different infrastructure tiers is different. Sometimes, scripts or commands need to be executed to get additional details. All of this is beyond the scope of what help desk staff can handle.
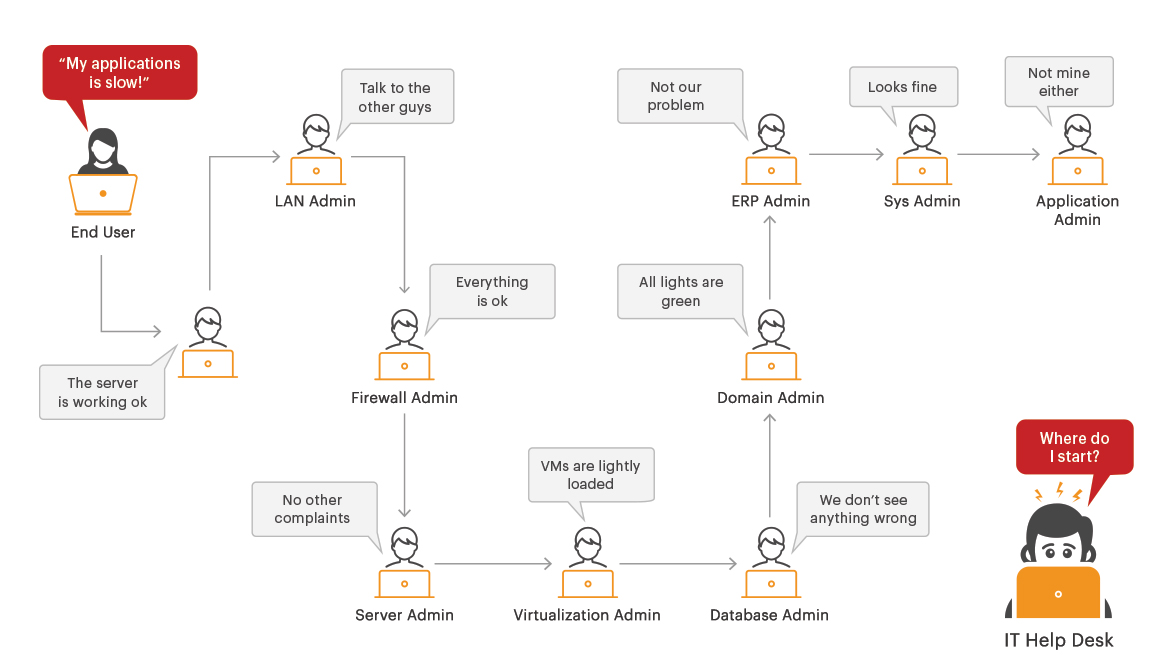
Help desk teams often have limited or no access to monitoring tools. Neither do they routinely have access to any tools that can assist them in triaging problems quickly. Hence, they are often responding to user complaints without any direct visibility into how the services they are supporting are performing and where the problems may be. Therefore, it is no surprise that many issues are being escalated to the IT operations teams and even worse, being escalated to the wrong person or team.
A Healthcare Analogy
 To understand this issue in more detail, let’s take a healthcare analogy. There are many specialist doctors: dentists, orthodontists, dermatologists, cardiologists, etc. When you don’t feel well, you don’t go to the specialist first. You go to the general practitioner. The general practitioner performs basic checks and most often addresses the issue. If the problem is very severe, he/she refers you to one of the specialists.
The general practitioner is also lower cost and easier to get access to than the specialists.
In the IT world, we mainly have specialized monitoring tools – network, database, application code monitoring, etc. The general practitioner-like capability is totally lacking in IT organizations today. IT problems are often assigned based on what the help desk staff hears from users. If a user says, “Citrix access is slow,” the ticket is assigned to the Citrix team. This is just the wrong thing to do. Citrix desktop access may indeed be slow, but the user is not aware of the underlying infrastructure delivering the service. The problem could be in the network, in the virtualization platform, in storage, or in the cloud.
Help desk teams need a general practitioner equivalent capability that they can use to determine what is causing a problem and which team they can direct the problem to. The focus should not be on giving more check lists and decision trees to the help desk, but rather in providing them tools that can empower them to troubleshoot complaints effectively and quickly.
How to Empower Help Desk Teams to Triage Problems Quickly and Effectively
Organizations can gain significantly by empowering help desk teams (particularly Level 1 and Level 2 staff) to triage problems quickly and effectively. When help desk teams triage problems quickly and well:
 They can direct the problem to the right specialist, and thereby, reduce the mean time to repair (MTTR).
- Unnecessary problems will not be directed at the domain experts. They will have more time to focus on productive activities, rather than spending a large amount of time firefighting routine problems. This enhances IT productivity.
- Users will get a rapid and accurate response to their complaints, which improves user satisfaction.
- IT operations costs are also reduced because any user complaints are handled by lower cost help desk resources, rather than domain experts.
In order to be more effective, help desk teams do not need access to all the expert monitoring tools. They need:
- A view of the current service quality being delivered to users, so they can quickly see if there is a service problem that is affecting the majority of their users
- A single pane of glass from where they can see all the application and infrastructure tiers
- Access to technology that helps them triage problems quickly and determine where the cause of a problem lies: network, database, application, code, cloud, etc.
- The ability to just see the details they need and not be overwhelmed with millions of metrics.
How eG Enterprise Empowers Help Desk Teams to Triage Problems Quickly and Effectively
eG Enterprise assists help desk teams in many ways:
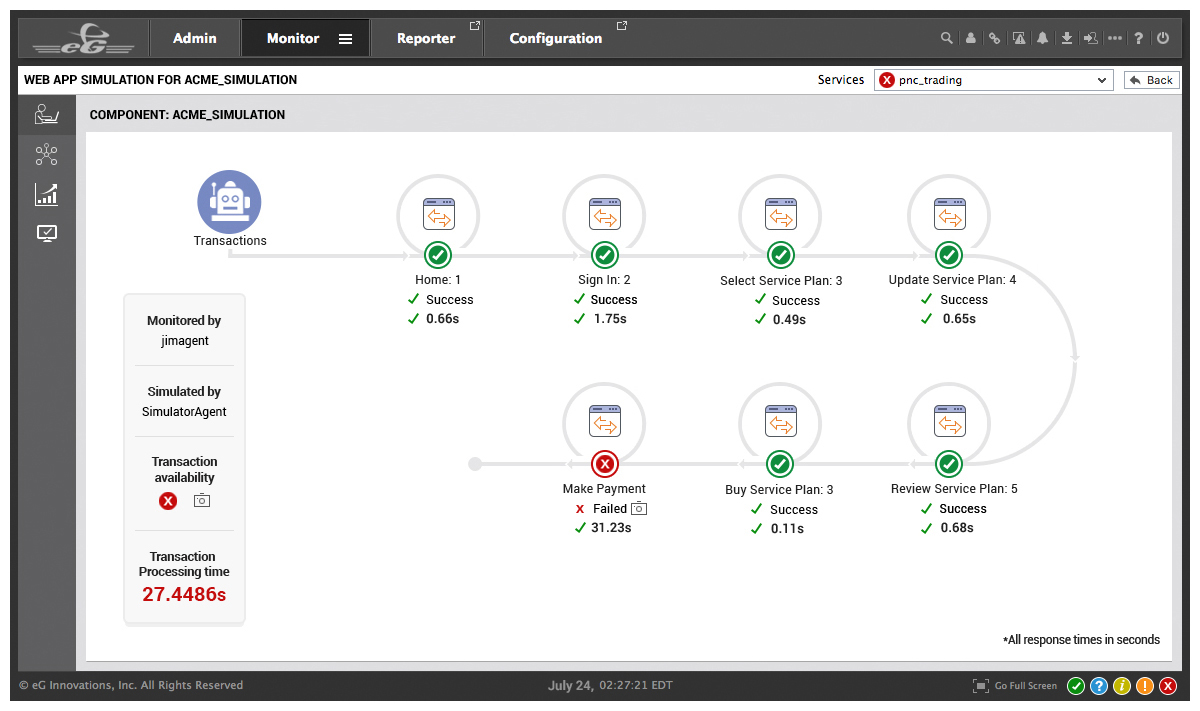
- Help desk teams get visibility to service performance: Rather than focus on the tier-wise health, eG Enterprise first assesses service health as seen by users. Using indicators of user-perceived performance, help desk staff can see if the service has degraded for all users, some users, or none. Synthetic monitoring set up from different strategic locations can be used to provide help desk staff with guidance on whether users from specific locations are seeing issues. Figure 2 shows a dashboard that tracks the performance of a specific application’s workflow. Looking at this dashboard, a help desk person can quickly see if there is any step of the workflow that is slower than normal.
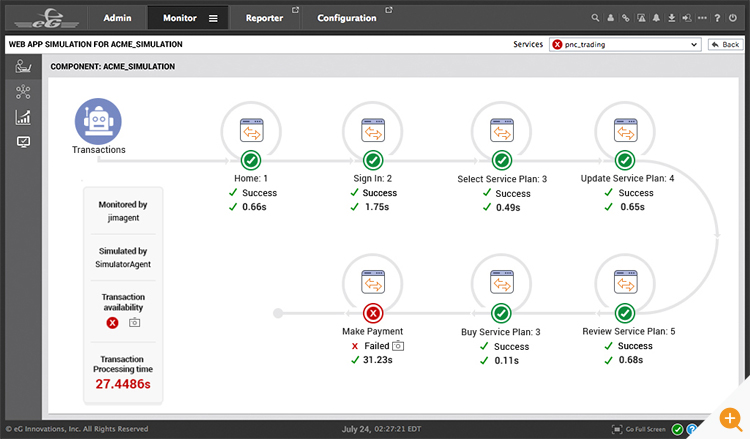 Figure 2: Simulation of a multi-step transaction. Color codes indicate if any steps are slowing down
Simulations can be set up from multiple locations or for multiple applications and dashboards presented to the helpdesk so they can easily see if there is a known problem affecting user access.
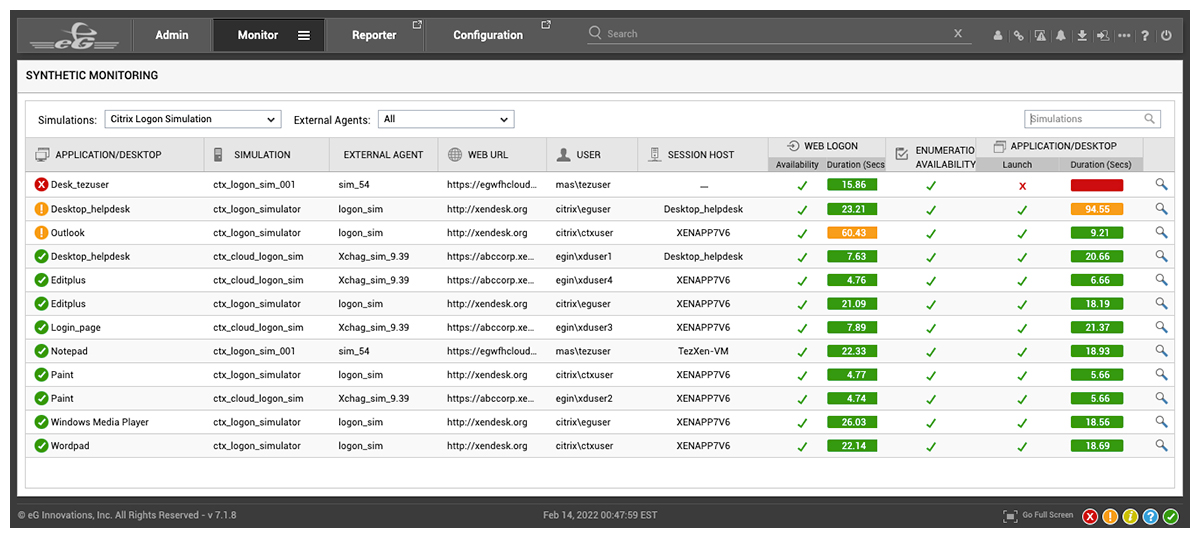
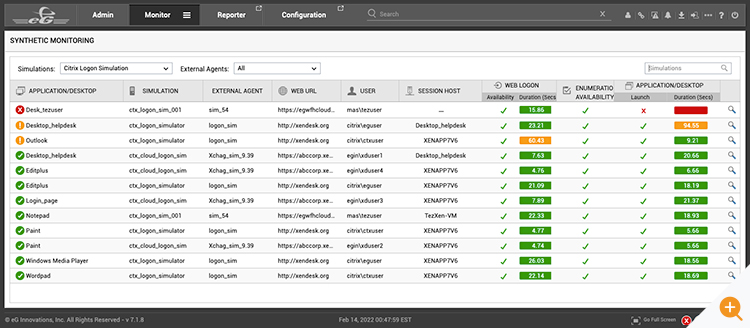 Figure 3: Synthetic monitoring of the performance of different web applications
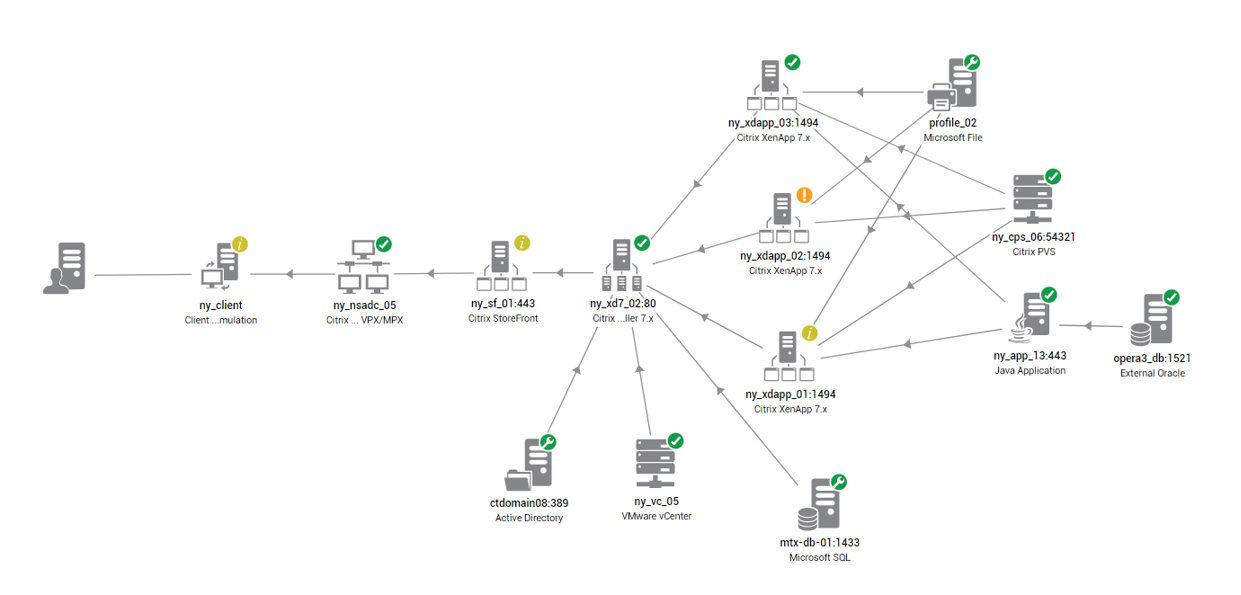
 - Help desk teams have visibility into the performance of every layer, every tier of the service infrastructure: Delivering a virtual app or a desktop involves several tiers of hardware and software that must work together. eG Enterprise auto-discovers the entire infrastructure, the inter-dependencies between the different tiers and provides help desk staff with a service topology map that depicts all the tiers involved. Using agent/agentless monitors, the status of each tier is checked and color codes on the topology indicate which tiers are working well and which ones are not. Help desk staff can be trained to look at the entire service delivery chain and follow color codes to determine which tier a problem lies in. Triaging problems using service topology maps does not require a great deal of domain expertise. Even an untrained person would be able to look at a topology map within eG Enterprise like the one below and identify which service in the delivery chain is causing problems:
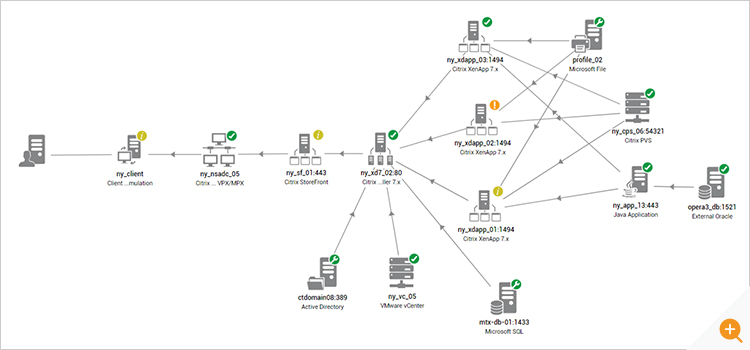 Figure 4: A service topology map highlighting how each tier is performing. Color codes guide the help desk operator and can be used to triage problems quickly
The color codes on the different tiers are determined by sophisticated AIOps technology embedded in eG Enterprise. If a storage device has a failed disk, this could slow access to it, the virtual infrastructure may be slow, and Citrix access could be affected. Rather than reporting problems at each tier, the monitoring tool must lead the operator to the cause of the problem. This is what eG Enterprise achieves with its service topology map and auto-correlation technology. More details of eG Enterprise’s AIOps (Artificial Intelligence for Operations) capabilities are discussed in the eBook AIOps Solutions and Strategies.
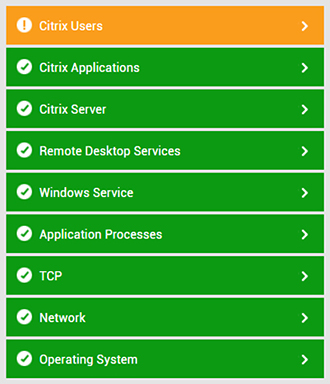 Figure 5: Layer model of a Citrix virtual apps server
The detailed metrics collected at each tier are grouped into a simple layer model representation. By looking at the health of the different layers, a help desk staff can determine where the problem lies and involve the right team. Figure 4 shows the layer model of a Citrix virtual apps server.
Here, a helpdesk member can clearly see that the server operating system is working well, network connectivity to the server is fine, the processes that need to be running are working, and there is some issue with user sessions on the server. So, the problem here can be directed to the Citrix admin, instead of the network admin or the system admin.
- Help desk teams can quickly zoom into a user session and troubleshoot it: From their web browser, help desk staff can search for a user by name. If there is a problem with any of these tiers, the help desk person will know immediately.
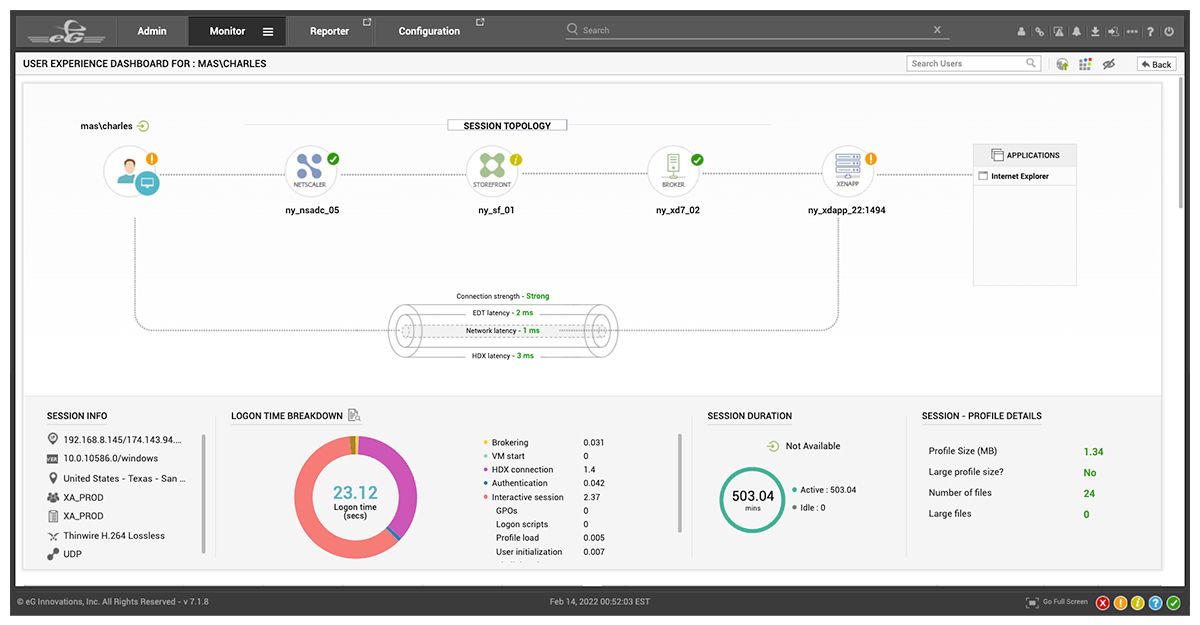
 Figure 6: Session topology of user john’s session
Notice in the above dashboard that the size of a user’s profile is also shown. If a profile is large or has many files, it makes logon slow, and the user might complain. From the dashboard in Figure 6, the help desk person can easily detect that the cause of a slow logon is a large profile or too many files in the user’s profile. This detection allows the problem to be immediately resolved by the user, without involving the Citrix experts.
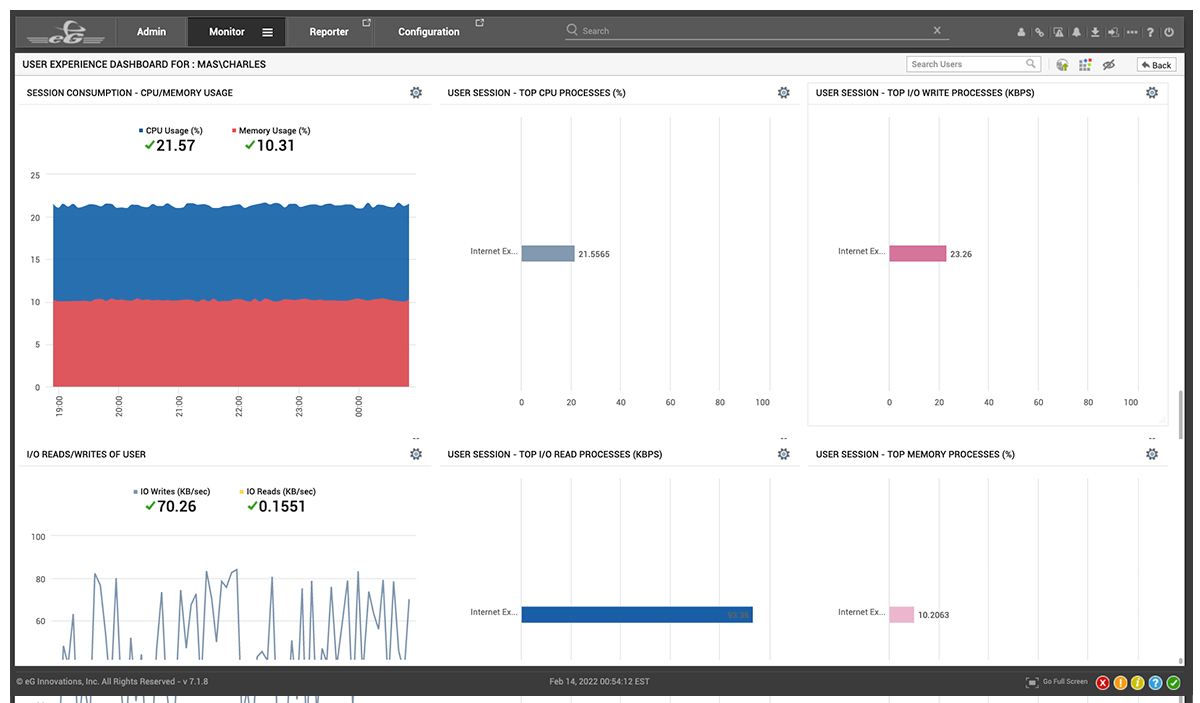
From the dashboard in Figure 7, the help desk staff can see the details of the user session: what applications is the user accessing, how much resources are these taking up, is the user accessing any application/site that is causing a problem, what is the bandwidth being used by the user in their session, etc. They can also see the network latency from the user terminal to the data center. This is usually a clear indicator that the problem is in the user’s connection – either the user’s ISP poor or their home network connection is poor. If the issue is specific to the user’s connection or with their resource usage, the help desk staff need not pass the problem on to the domain experts (e.g., Citrix team) for further analysis.
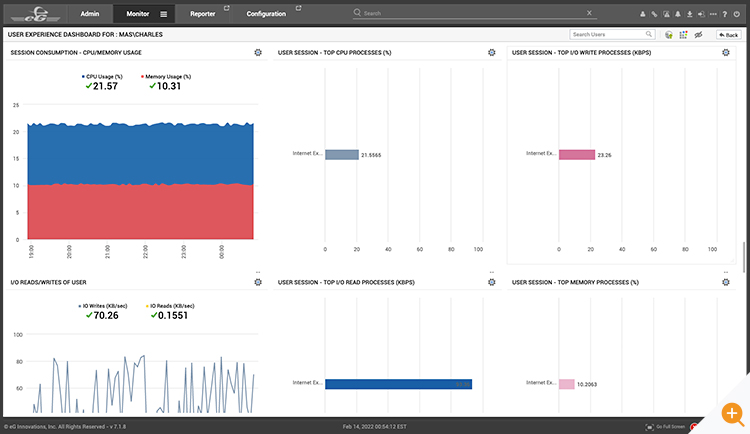 Figure 7: Display of CPU/memory resources used by the user and applications running in their session that are responsible for the usage
Help desk staff can also see the applications running in a user session and if they notice anything unusual, they can highlight this to the user (e.g., excessive bandwidth usage, high CPU usage of an application, memory leak in an application, etc.). This way they can avoid user-specific issues being passed along to the domain experts for handling.
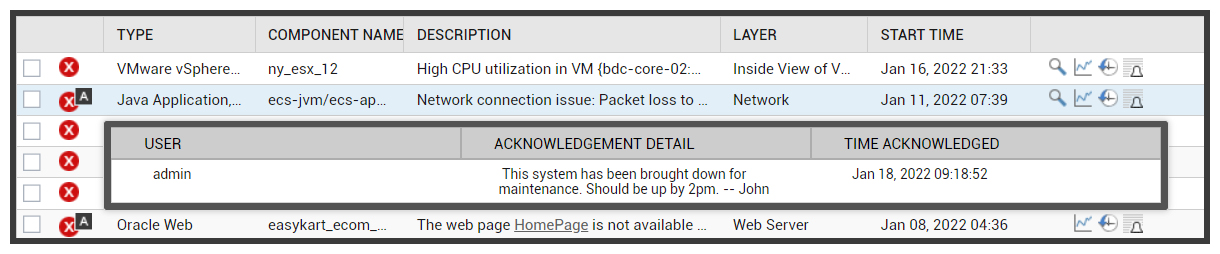
- Help desk teams have access to current alarms and status acknowledgements posted by the operations team: From the current alarms console, help desk teams can see all the currently detected problems with the applications and infrastructure. They also can see the acknowledgements and status of events posted by the IT operations team. This information allows them to effectively communicate with users, indicating if a complaint relates to a known issue and the current status of the resolution based on acknowledgement.>/p>
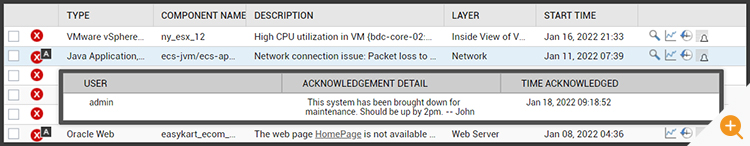 Figure 8: Help desk staff can see the list of current alarms with priorities and also see any acknowledgements added by the IT operations team.
These alarms and acknowledgements are tightly integrated with service desk tools like ServiceNow. So, the help desk staff can use their familiar tools to detect the current state of the applications and infrastructure.
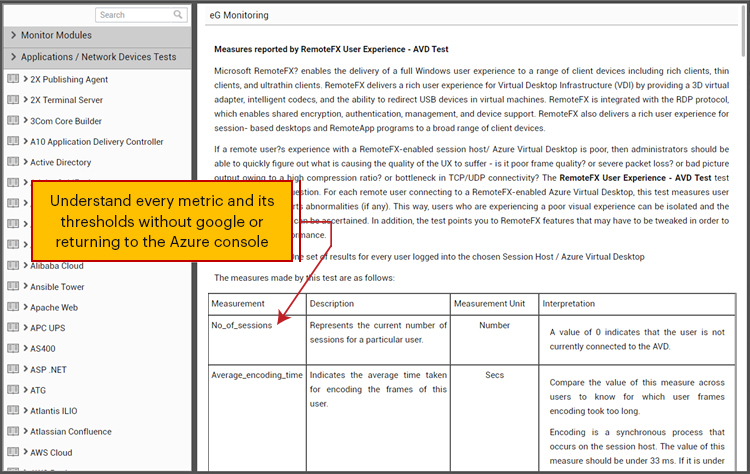
- A site-specific knowledge base feature allows help desk staff to determine how a problem was resolved in the past: Context sensitive help provides help desk staff with easy explanations of metrics, alerts, thresholds, events, and logs including troubleshooting information out of the box for all supported technologies. At the same time, a knowledge base capability allows them to have access to previous insights provided by IT operations teams on how to resolve a specific issue. A quick video shows how a knowledge base can also be integrated with fix histories to facilitate help desk.
Why Improving Help Desk Efficiency Matters
Many eG Enterprise customers have gone down the path of empowering their help desk teams with access to performance insights about their key IT services and infrastructure. Customized roles can be created to ensure that the helpdesk staff only have access to some of the screens of eG Enterprise. Empowering help desk teams ensures that organizations can address issues at the first possible instant – when the user calls in and thereby reap significant benefits.
One Fortune 100 organization reported a 33% reduction in problem resolution time for incidents because they were able to get their help desk teams to use the tool to detect and triage problems. Another organization reported a 900% ROI within 3 months of installing our solution because they were able to proactively learn about issues and detect them before problems even became customer impacting. You will find similar metrics and stats in many of our case studies; see: Case Studies.
eG Enterprise is an Observability solution for Modern IT. Monitor digital workspaces,
web applications, SaaS services, cloud and containers from a single pane of glass.
Learn More:
- Read more on how Service Desk Tool Integrations work and can be integrated into monitoring systems to automatically generate and manage tickets in systems such as Autotask, JIRA, ServiceNOW, Slack, Teams and others: Service and Help Desk Automation Strategies
- How AIOPs capabilities are used to automate root cause diagnosis, empowering help desk teams to identify the correct domain where issues have occurred and not where secondary symptoms and effects may have manifested: AIOps Tools – 8 Proactive Monitoring Tips and AIOps Solutions and Strategies for IT Management
- Digital Workspaces in the New Normal 2021 Survey Report (eginnovations.com) – A survey of 1000+ respondents including data on help desk operations that may help shape ROI assessments and audits of help desk efficacy and efficiency
- Many of our Managed Service Provider (MSP) customers and partners leverage eG Enterprise to grow their business offering customers premium and additional services, such as frontline help desk and enhanced monitoring and troubleshooting tools. Read how a selection of MSPs have grown their businesses Managed Services | Monitoring for MSPs (eginnovations.com).
 Rachel has worked as developer, product manager and marketing manager at Cloud, EUC, application and hardware vendors such as Citrix, IBM, NVIDIA and Siemens PLM. Rachel now works on technical content and engineering and partner liaison for eG Enterprise