


Today I will cover monitoring and troubleshooting AVD (Azure Virtual Desktop) connection issues and problems. Microsoft Azure Virtual Desktop (AVD) is a powerful cloud-based service that enables organizations to deploy and manage virtual desktops and applications. It provides users with a seamless remote desktop experience, allowing them to access their resources from anywhere. However, like any technology, AVD can encounter connection failures, causing frustration and disruption for users.
Microsoft has documented how the Azure Virtual Desktop connection works after the user has initiated the connection. It is worth having a reasonable understanding of this process to understand the components involved in AVD connectivity.
AVD connection failures can happen within the Azure global infrastructure, inside the Azure Session hosts, because of FSLogix profiles, due to Azure Storage, and many other reasons. Microsoft has documented some troubleshooting articles here:
- Troubleshooting Session host virtual machine configuration issues – https://learn.microsoft.com/en-us/azure/virtual-desktop/troubleshoot-vm-configuration
- Troubleshooting Azure Virtual Desktop Agent issues – https://learn.microsoft.com/en-us/azure/virtual-desktop/troubleshoot-agent
- Troubleshooting Azure Virtual Desktop commons issues – https://learn.microsoft.com/en-us/azure/virtual-desktop/troubleshoot-set-up-overview
If you are managing large AVD infrastructures, proactively analyzing AVD connection failures with automated alerting, will allow you to resolve issues before they impact a significant number of your users avoiding support tickets and helpdesk calls. You are likely to need to answer the following questions:
- Which users are having frequent connection failures and what is causing them?
- Which session hosts are having the most connection failures and what is causing them?
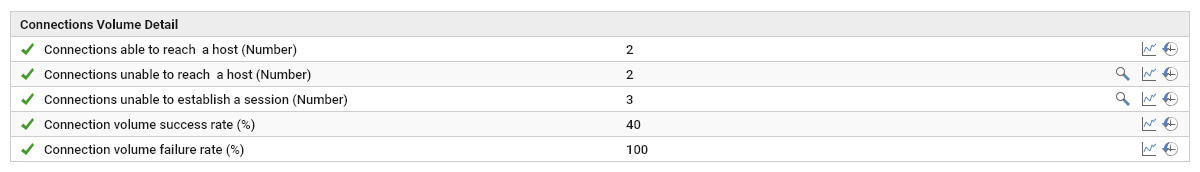
- How many connections can reach session hosts successfully?
- How many connections cannot reach session hosts? Which hosts are affected? Who and where are the users affected?
- How many connections cannot establish sessions on session hosts? Who is affected by this?
- Percentage of connections split by success and failures?
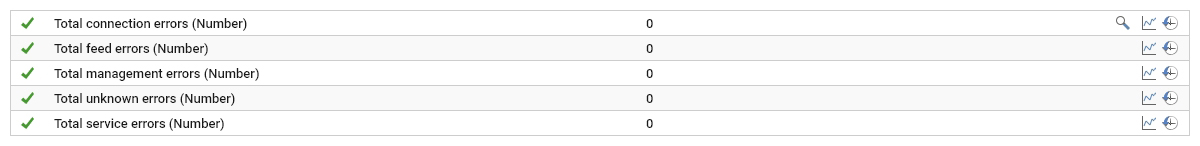
- Does the connection fail due to management errors or service errors or feed errors?
- Which stage of connection sequence is causing the most failures?
- Are there patterns in the connection failure types?
- Do slice and dice reports analyzing connection failures reveal a common root-cause?
In this blog, I will cover core features in eG Enterprise that enable you to analyze Azure Virtual Desktop connection failures easily without switching multiple screens, parsing or manually trawling diagnostic logs, and avoiding having to mine the Azure Virtual Desktop session host event logs.
Automated alerting for AVD Connection problems and failures
Out-of-the-box eG Enterprise collects key metrics and continually monitors data in the logs. Metric thresholds are automatically calculated and applied, and alerting raised if anomalies or concerning symptoms are seen.
When potential issues arise, further data is collected and made available to diagnose and pinpoint the root-cause of issues and to provide sufficient data to diagnose and understand issues. This information is available where the “Detailed Diagnosis” icon appears in the eG Enterprise interface (it is a magnifying glass icon).
In a large AVD infrastructure, it is impossible to keep track of connection failures and identify hosts that are not accepting connections. eG Enterprise does this automatically via AVD Broker monitoring by tracking individual AVD connections initiated by your users and distinguishing between the successful and failure connections. Usually, connections fail if the host is not reachable or if there are issues (for example, resource contention or configuration issues) on the host. eG Enterprise collects diagnosis information such as the hosts that are not accepting connections and the associated reasons for failure connections.
Sometimes, the connection fails due to the Microsoft infrastructure itself. You can get insights on such issues too.
Learn more about how AIOps platforms such as eG Enterprise automate alerting and avoid alert storms by automating root-cause diagnosis with alert correlation, see: AIOps Powered Monitoring | eG Innovations.
AVD Connection Failures – Reports
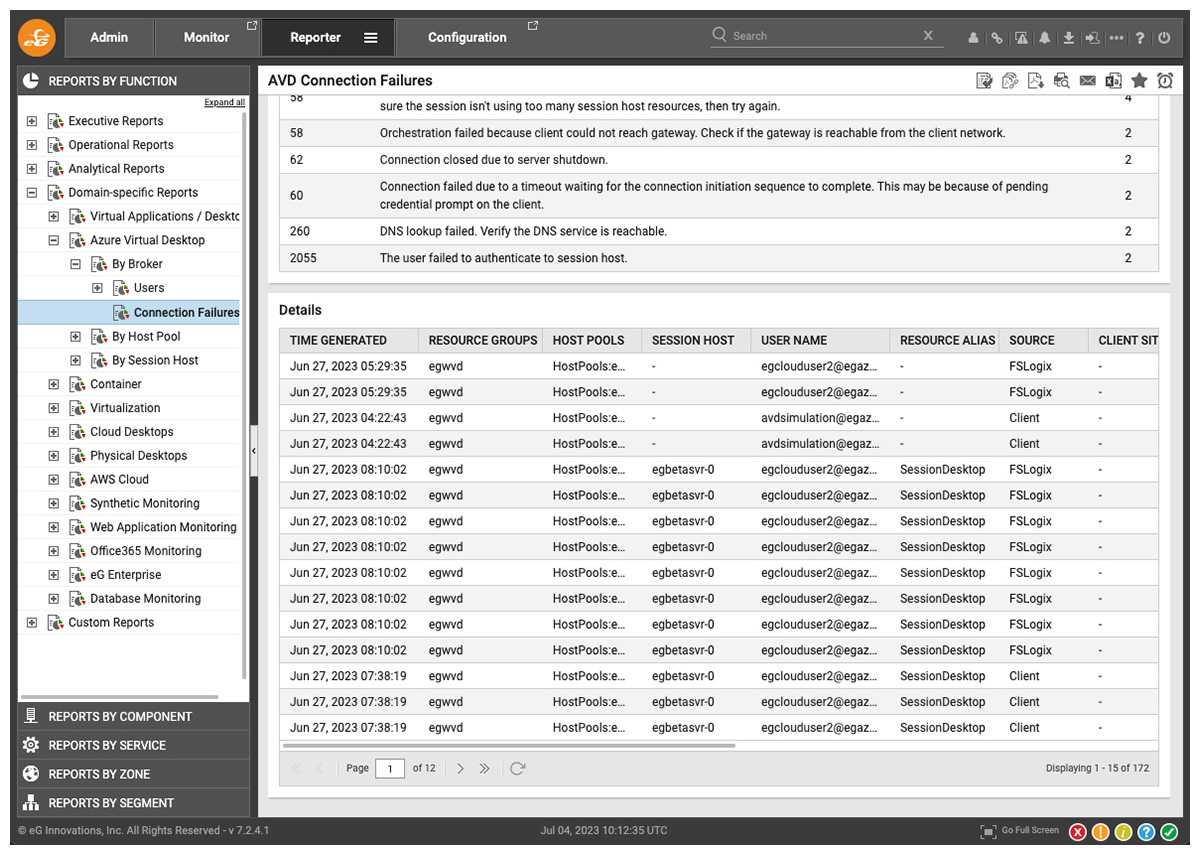
Besides real-time monitoring, eG Enterprise provides ready-to-go reports for AVD including a dedicated “Connection Failures” report. This allows IT Operation teams to overview and review connection problems retrospectively and over longer timeframes, particularly useful if connection issues are intermittent or users have a tendency to report issues after the fact. You can access this report via the “Reporter” tab in the main eG Enterprise console and following the menu path Domain-specific Reports -> Azure Virtual Desktop -> By Broker -> Connection Failures.

When you select the “Connection Failures” report, you can filter the report based on resource groups, host pools, users, etc. You also have control over the timeframes of reports whether that’s over the previous hour, day or week or over a past time window of a length of your choice. Reports can be scheduled regularly and emailed to interested parties to provide updates.
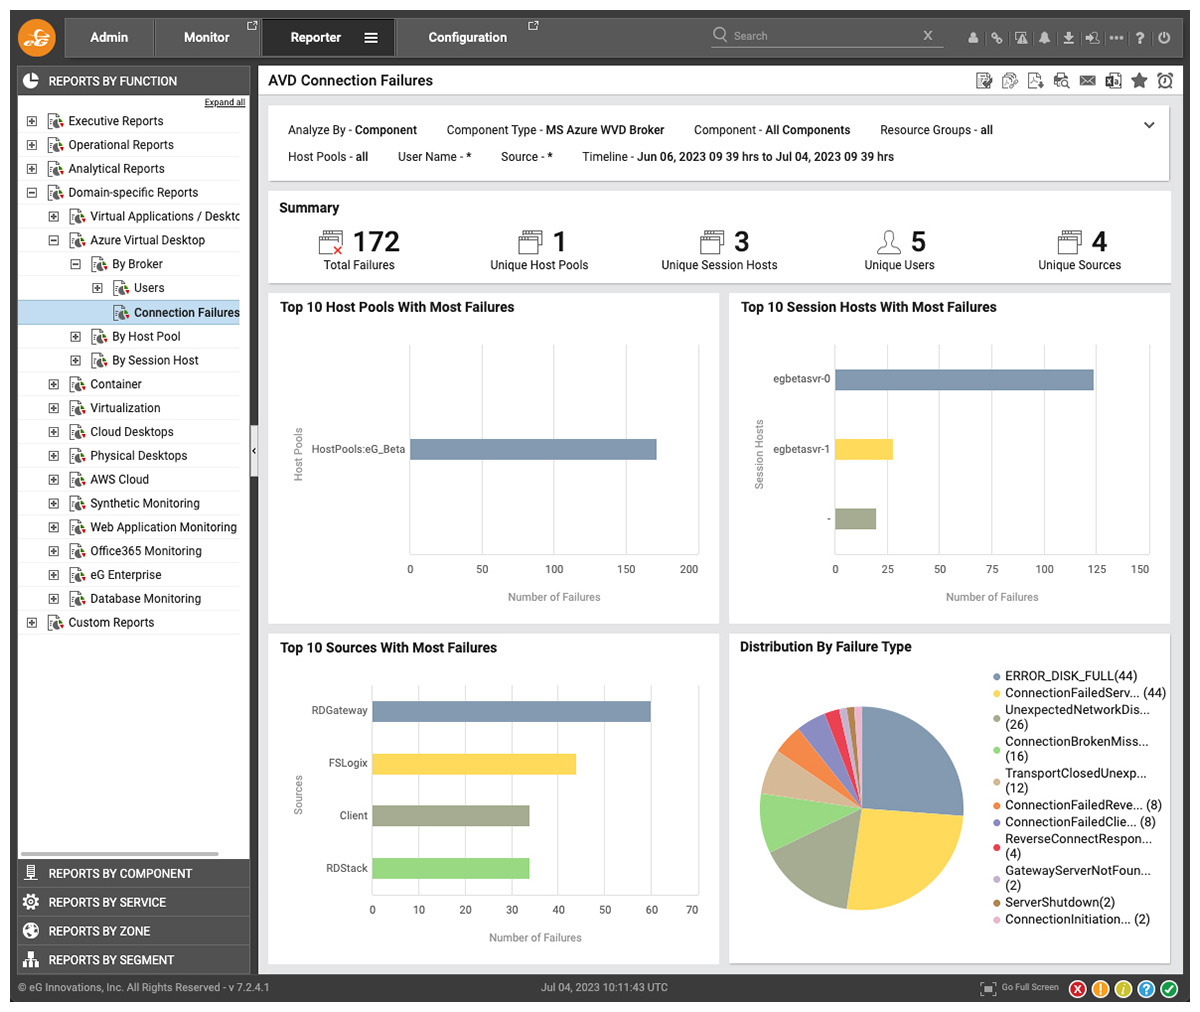
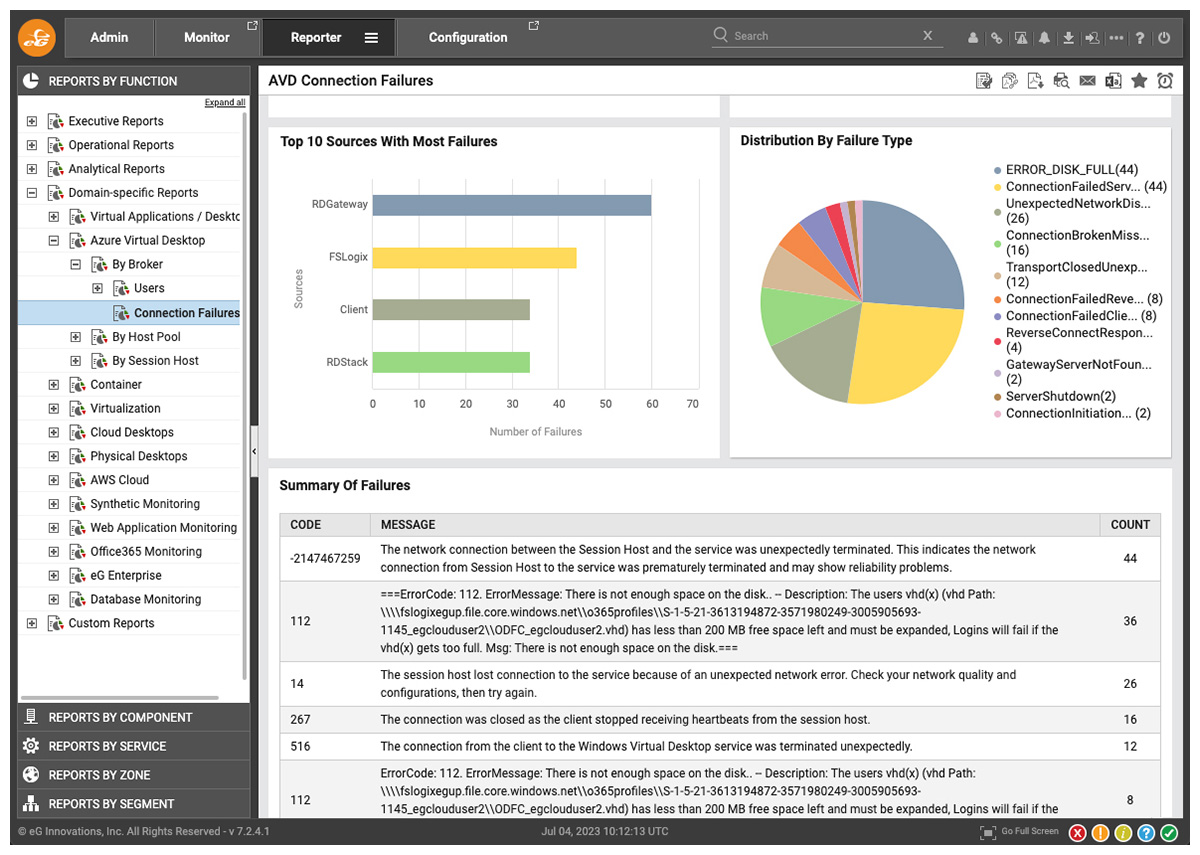
Scrolling down through the Connection Failure reports, administrators can view details on the specific error codes and types associated with failures and within which component errors are occurring e.g., if it is an FSLogix issue, an RDGateway problem, an issue on the Client and so on.
Conclusion
Azure Virtual Desktop offers tremendous flexibility and productivity gains for organizations. However, connection failures can occur due to various factors such as network connectivity, authentication and authorization issues, and infrastructure-related glitches. By following the troubleshooting steps outlined in the Microsoft blogs along with eG Enterprise Connection Failure Analysis reports and metrics, you can effectively diagnose and resolve connection failures in Azure Virtual Desktop, ensuring a smooth and uninterrupted remote desktop experience for your users.
eG Enterprise is an Observability solution for Modern IT. Monitor digital workspaces,
web applications, SaaS services, cloud and containers from a single pane of glass.
Related Information
If you found this blog interesting or useful, you may be interested in:
eG Enterprise is an Observability solution for Modern IT. Monitor digital workspaces,
web applications, SaaS services, cloud and containers from a single pane of glass.
- Read my guide to troubleshooting and diagnosing slow AVD logons, see: Troubleshoot Slow Azure Virtual Desktop Logons (eginnovations.com).
- By default, AVD connections are now made via UDP based RDP Shortpath, understanding how to monitor and troubleshoot RDP Shortpath is essential for those working with AVD, our simple guide on understanding and diagnosing RDP Shortpath should equip you to troubleshoot your connections, see: RDP Shortpath Monitoring in Azure | eG Innovations.
- AVD relies on Reverse Connect for secure connections, this means tools and information you may be used to having available on-prem are restrictred and you have to obtain information such as end-point client IP addresses from the AVD Broker directly, read more: Reverse Connect for Azure Virtual Desktops | eG Innovations.
- For information on AVD Broker monitoring, alerting and troubleshooting, see: Monitor and investigate AVD Broker issues | eG Innovations.
- Authentication and authorization is a critical pre-requisite to establishing connections and needs to be monitored, if using Azure AD you may wish to review how you monitor and troubleshoot Azure AD within an AVD environment, see: Azure Active Directory Monitoring | eG Innovations.
 Babu is Head of Product Engineering at eG Innovations, having joined the company back in 2001 as one of our first software developers following undergraduate and masters degrees in Computer Science, he knows the product inside and out. Based within our Singapore R&D Management team, Babu has undertaken various roles in engineering and product management becoming a certified PMP along the way.

