


Introduction to Kubernetes and Kubernetes Monitoring
Over the last couple of years, Kubernetes (often called K8s) has become the most popular and well-known container orchestration system for automating application deployment, scaling, and management. Scheduling containers at scale in a cloud-native ecosystem is central to the technology. Kubernetes itself is an open-source project, and as such presents challenges for many enterprises especially in regulated industries with strong security requirements and formal SLA commitments. Red Hat have developed a paid for commercially available product OpenShift around core Kubernetes to better suit the need of enterprises that offers additional security controls, UI features, a ready-to-go CI/CD integration solution, container management features and most importantly full enterprise support contracts with Red Hat committed to resolve issues. In this article, we will help you understand the top 15 key Kubernetes monitoring metrics.
Kubernetes and OpenShift have a decentralized architecture with many independent and inter-related components and control loops. Kubernetes functions on a declarative model and implements the concept of a “desired state”. Kubernetes continuously monitors the state of the elements of the Kubernetes cluster and make sure the current state does not vary from the desired state.
Controlling scaling to achieve the desired state is an important feature of Kubernetes; consider a vendor launches a web service-based application e.g., a clickable map of their hot beach club locations; it gets promoted by a celebrity and demand surges. Suddenly, the back end of the application cannot cope and the hosting server crashes/hangs; the end user finds the map is slow, unresponsive or perhaps not available. In a Kubernetes environment the desired state is that the application is performant and available and this could be achieved by deploying additional instances of the application within containers ultimately on additional servers and hardware to deal with the demand surge.
Since the containers are stateless, Kubernetes can generate millions of metrics each day. Additionally, the infrastructure itself is dynamic and changing, containers and servers may be spun up as needed and then scaled back and destroyed when appropriate. One of the most challenging aspects of Kubernetes monitoring is filtering through the metrics and pay attention to critical ones whilst also keeping track of the state of the system and with what these metrics are or were associated. These metrics can be the baseline for your Kubernetes monitoring strategy.
Since Kubernetes is declarative, the key to success is understanding the system and defining what the optimal “desired state” is and how the system should try to achieve that state. Comprehensive Kubernetes monitoring allows you to understand your systems and what if any changes you need to make.
Key Kubernetes Terms
- Kubernetes: Also known as K8s, is an open-source system for automating deployment, scaling, and management of containerized applications.
- Kubernetes Cluster: It is a set of nodes that run containerized applications. Containerizing applications packages an app with its dependences and necessary services. Containers are more lightweight and flexible than virtual machines.
- Pods: They are the smallest deployable units of computing that you can create and manage in Kubernetes. A Pod is a group of one or more containers, with shared storage and network resources, and a specification for how to run the containers. A Pod’s contents are always co-located and co-scheduled.
- Node: It may be a virtual or physical machine. The components on a node include the kubelet, a container runtime, and the kube-proxy. Each node is managed by the K8s control plane and contains the services necessary to run Pods.
- Container Image: It is a ready-to-run software package containing everything needed to run an application: the code and any runtime it requires, application and system libraries, and default values for any essential settings.
- Container Runtime: It is the software that is responsible for running containers. Kubernetes supports container runtimes such as containerd, CRI-O, etc.
- Deployment: It provides declarative updates for Pods.
- DaemonSet: It ensures that all Nodes run a copy of a Pod. As nodes are added to the cluster, Pods are added to them. As nodes are removed from the cluster, those Pods are garbage collected.
- Namespace: It provides a mechanism for isolating groups of resources within a single cluster. Names of resources need to be unique within a namespace.

Top Monitoring Metrics for Kubernetes and OpenShift
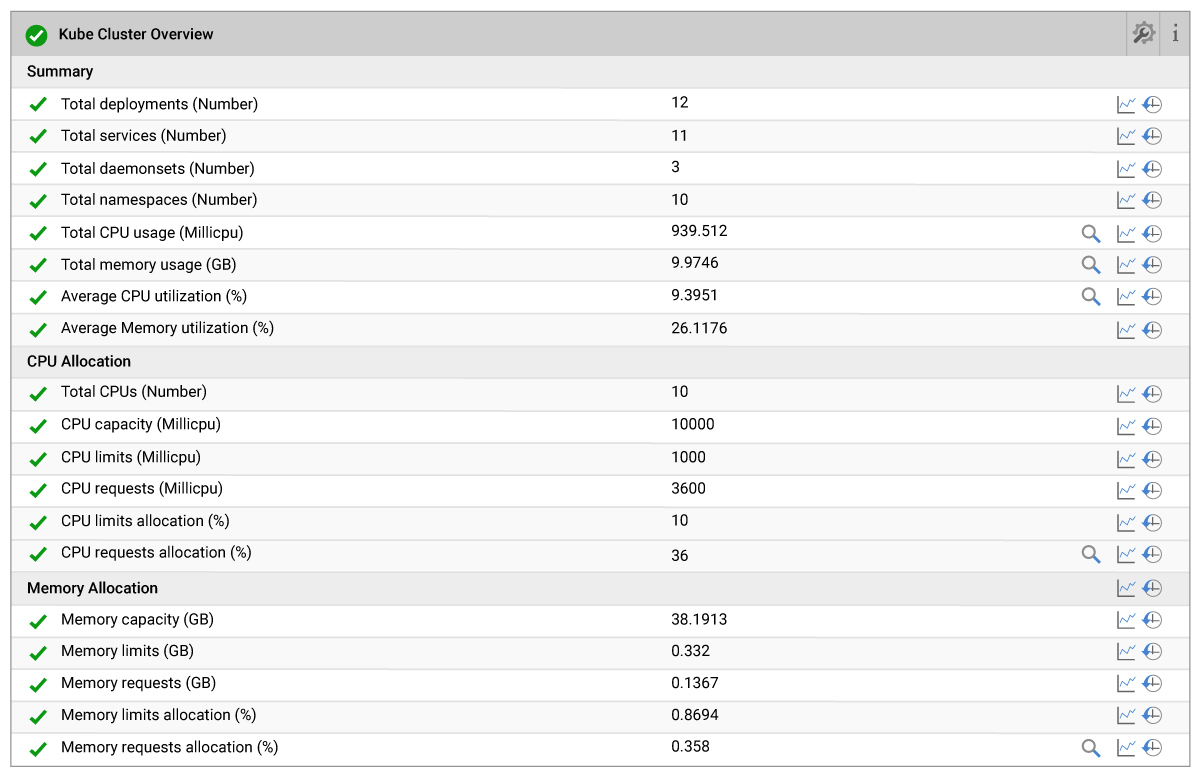
1. Cluster CPU and Memory Utilization
It is important to have the complete visibility into the state of the Kubernetes cluster. Besides knowing the number of deployments, namespaces, services and daemon sets created in the Kubernetes cluster, it is essential to know the Cluster-wide CPU and Memory utilization. A Kubernetes administrator assigns the CPU and Memory resource requirements to pods by requests and limits. Requests are the minimum amount of CPU/Memory assigned to pods. Limits are the maximum amount of CPU/Memory can be consumed by pods. By knowing this Cluster-wide CPU and Memory utilization, the Kubernetes administrator can avoid errors such as:
- “Failed Scheduling No nodes are available that match all of the following predicates:: Insufficient CPU”,
- “Failed Scheduling No nodes are available that match all of the following predicates:: Insufficient memory”
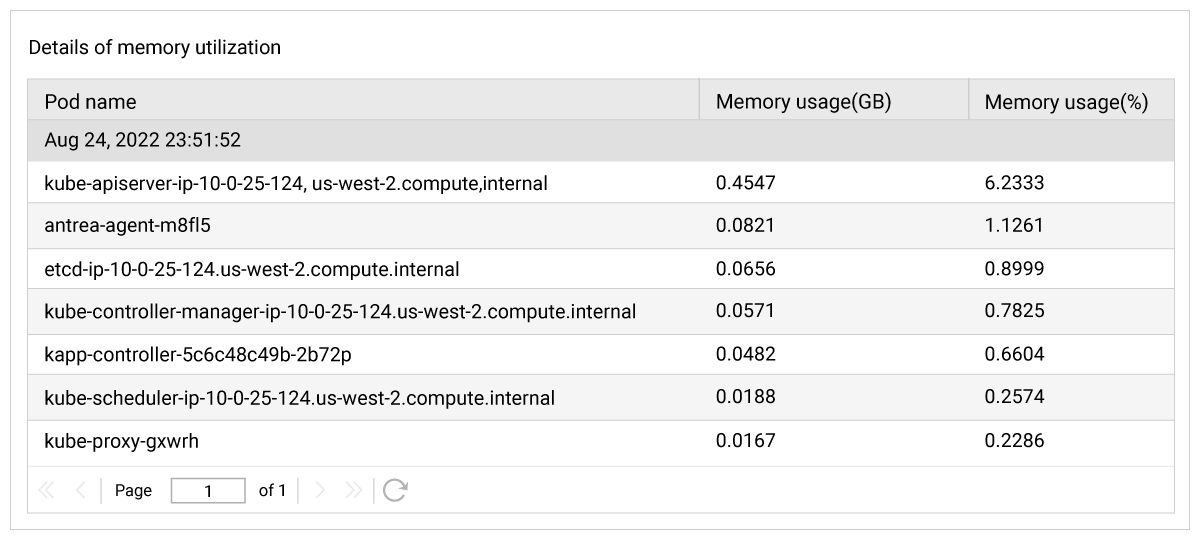
Detailed diagnosis in eG Enterprise show how much CPU/Memory is consumed by the pods running on each node in the cluster. This enables you to make decisions such as whether to add more CPU/Memory in the existing node or whether to adjust the requests and limits for pods. Detailed diagnosis is a feature which ensures that deeper insights are collected when a problem is detected; the detailed diagnosis icon (the magnifying glass) appears indicating additional information is available; clicking on the magnifying glass will access the drilldown into the diagnostic information.
2. CrashLoopBackOff Events
A CrashLoopBackOff status for a pod means that you have a pod starting, crashing, starting again, and then crashing again – this would make any dependent applications unstable.
This issue can happen for several reasons. Some of the most likely causes are:
- Some parameters of the pod or container have been configured incorrectly
- The application itself running inside the container is repeatedly crashing
- It is not possible to create or access persistent volumes
- Failure to load the application configuration file
- The application fails due to being unable to reach another service, which may be a third-party service
- The required images for the container are not available or not accessible
- There are insufficient resources to run the containers on the node
Manually troubleshooting the CrashLoopBackOff container is one of the most dreaded tasks for any Kubernetes administrator. eG Enterprise makes this simple, when a Crash Loop happens in the Kubernetes environment. You will get an alert immediately and automatically. You will have instant access to diagnostic information such as how many times the container has restarted in the last measurement period. Additionally, detailed diagnosis automatically pinpoints the root-cause reason for the Crash Loop so that you can take measures to correct the underlying issues.

3. Persistent Volume Failures
Pods are usually stateless which makes spinning containers up or down easily. Since there is no data to be saved and to be migrated, the cluster does not deal with intensive tasks involving a significant volume of disk read and write operations. So, a pod can be recreated without having to worry about losing any data from the container. However, for certain applications particularly databases, the state of the application is vital and must be maintained.
Kubernetes supports stateful workloads by using Persistent Volumes. A Persistent Volume for a container is essentially just a directory and what is behind it is transparent to the container. So, the volume could be from the local hard disk, or an EBS volume from AWS or Azure Disk from Microsoft Azure. A Persistent Volume is managed by the cluster and remains available outside of the pod lifecycle and can be claimed by other pods. eG can detect and alert on a range of persistent volumes issues as shown below. When the persistent volume is no longer needed by the pod, it should be reclaimed. If the reclamations fail for whatever reasons, it should be investigated.

4. Horizontal Pod AutoScaler Issues
Horizontal Pod AutoScaler (HPA) allows users to scale up and down the number of pods based on target values (a “desired state”), for example (CPU Utilization). If the target is surpassed, HPA creates new pods but if it drops below the set target, it destroys the pods. To set an appropriate target value, you need to monitor the performance of the application and understand the application behavior. eG Enterprise can monitor the performance of the containerized application and baseline the workload. The Kubernetes administrator can set appropriate target value by using the baselines that eG Enterprise will automatically collect and evaluate for them. Additionally, eG Enterprise helps you detect issues related to HPA as shown below.

5. Node Conditions
A node in the Kubernetes cluster can be a physical machine or a VM. The node health (Condition) is determined by several metrics like CPU, Memory, Network, Disk, Pod capacity etc. Based on the node health, it will be selected by the scheduler to be used for the pods. eG can alert you on the conditions given below.

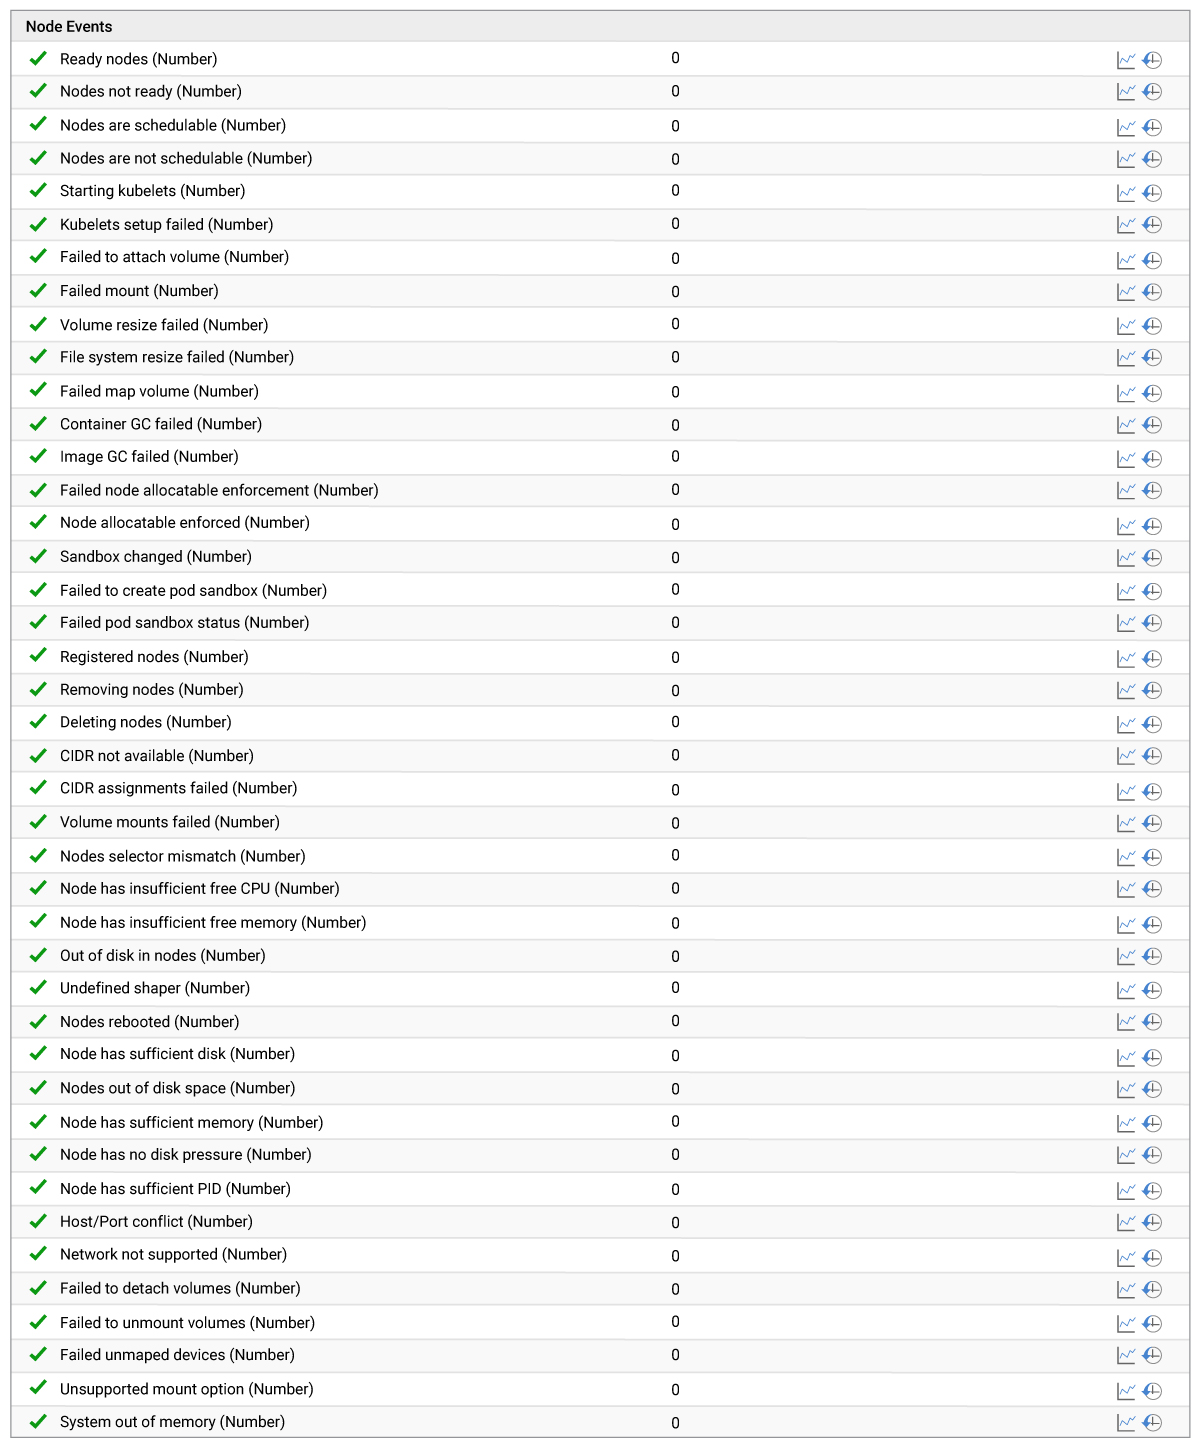
6. Node Events
Containers run on nodes and consume resources. Images gets downloaded from a repository and are stored on the node. A container can fail to run due to several node issues listed below. “Out of Memory” is an example where the node has insufficient memory. eG Enterprise can track all these cases and alert you proactively to recover the node as quickly as possible. We will show context additional details (detailed diagnostics) for each measure if issues arise. Alerts and conditions for alerts are configured out-of-the-box and administrators are free to customize alerts as desired.
7. Deployment Issues
Deployment in Kubernetes involves managing the lifecycle of pods including upgrades. When there are fewer available pods than desired pods for several minutes, a deployment would be considered as unhealthy. Common causes of an unhealthy deployment are:
- Incorrect image specified in pod spec
- A node being terminated
- Pod stuck in a crash loop
- Pending pods
It is good practice for a Kubernetes administrator to ensure that the number of available and ready pods are same. If there is a mismatch, one or more deployment can failed.

8. Pods with Pending Status
If the pod is in “Pending” status, it cannot be scheduled into a node. Common reasons for this include:
- Insufficient CPU resource on the node
- Insufficient Memory resource on the node
- Zero (no) nodes are available
- Container network not ready
- Unavailable image in the repository

eG Enterprise shows you which pods are in pending state and why they are pending via the detailed diagnosis icon (the magnifying glass).

9. DaemonSet Issues
DaemonSets are used to manage the pod that needs to be run on all nodes in a cluster. Daemonsets are very useful in use cases including monitoring, logging, virus scanning and intrusion detection, etc.
Common causes of an unhealthy daemon set are:
- Pod stuck in a crash loop
- Pending pods
A Kubernetes administrator should ensure that the number of available and running Daemonsets are same. If there is a mismatch, one or more Daemonset has failed and will need to be investigated for the above issues.

10. Cluster Health Conditions
When containers running on the node, physical resources are consumed. So, it is important to know the health condition of physical resources from the Kubernetes cluster point of view.
eG will help you to identify whether any of the nodes in the cluster is experiencing:
- Disk Pressure (Node is using too much disk space)
- Memory Pressure (Node is running out of Memory)
- PID Pressure (Node has too many processes/containers and unable to create newer processes)
- Network Pressure (Node has misconfigured Network configuration, unstable network, etc.)

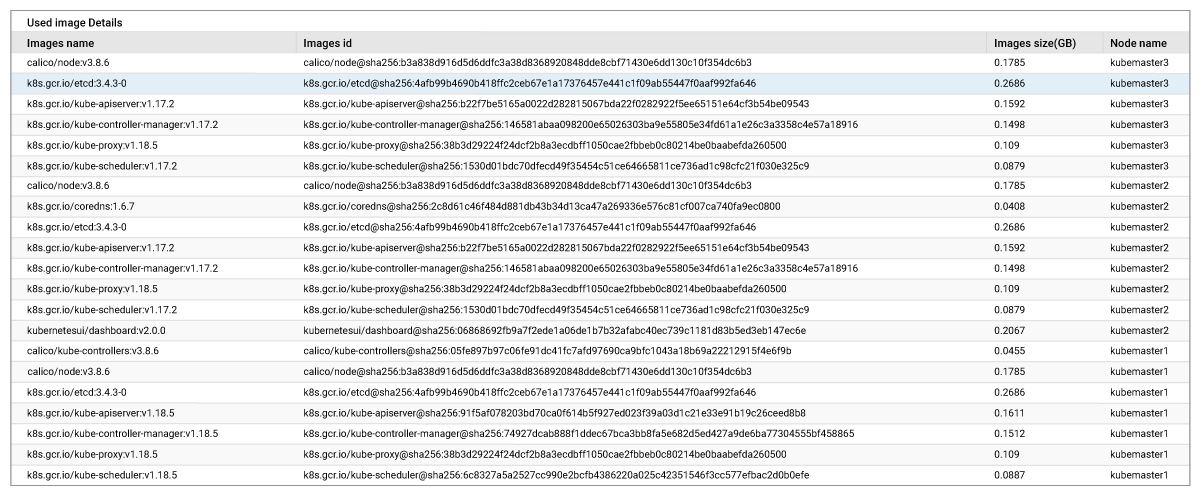
11. Tracking Container Images
Containers can fail to run if the required images are not present in the repository. Containers can also misbehave an outdated image is pulled. eG Enterprise will help you to know which images are pulled from the repository and available on the nodes. Additionally, if the container is unable to get the images, eG will alert you proactively with full details about which image is not accessible.

Cluster wide image overview.

Details of images loaded on each node.
12. Kubernetes Control Plane Monitoring
The Kubernetes Control Plane has many essential services such as etc-d, scheduler, controller-manager and API server, etc. If these services are down, the cluster cannot execute perfmon effectively. eG can proactively monitor and alert you if any of these essential services are down to assist quicker recovery of the cluster before it impacts the users.


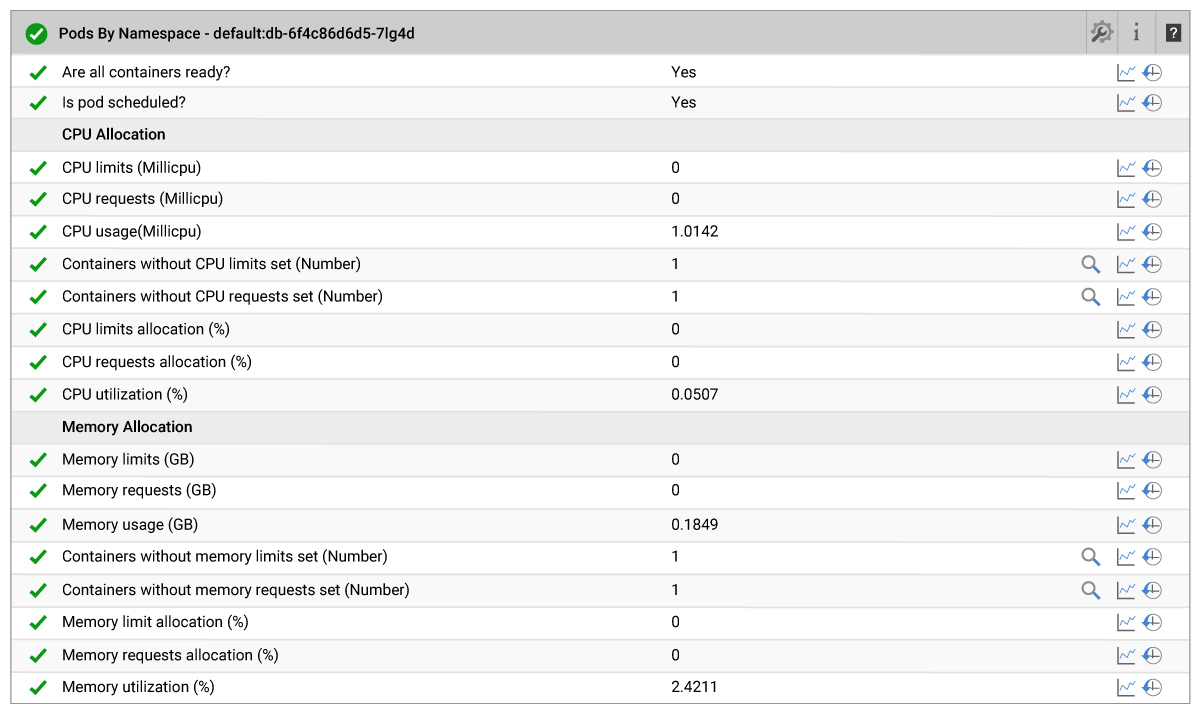
13. Pod Resource Monitoring
A pod can have many containers scheduled on the same node. If any of the containers in the pod are not ready, the pod will be in pending state. It is important to know all the containers in the pod are in ready state. It is also important to set the CPU and Memory limit for each container in the pod. If any of the containers in the pod does not have a CPU/Memory limit, that container can potentially consume all of the CPU/Memory resources on the node and results in an OOM (Out of Memory) condition. eG Enterprise alerts you if any of the containers in the pod have such issues.
14. Service Types
The Kubernetes Service construct helps to manage the load balancing configuration for pods, that enable pods to scale easily. The Service provides a single IP address and DNS name by which pods can be accessed from outside. It is a best practice to determine and audit the type of service assigned to the pod to reduce the security risks as this involves exposing something onto the internet with few to no security controls.
- If the service type is “LoadBalancer”, then the cloud you are on will create a load balancer. In AWS, this is ELB (Elastic Load Balancer -external by default) and in GCP this is LoadBalancer (external). Anytime a service with “LoadBalancer” type is created, the security team should review it for verification and approval.
- If the service type is “NodePort”, it will open a port on all the nodes where it can be reached by the network external to the cluster. Caution should be taken when making this decision.

We can show the pods that are using this service.

15. Garbage Collection Monitoring
Garbage collection (GC) is a helpful function of kubelet (the kubelet is the primary “node agent” that runs on each node) that will clean up unused images and unused containers. Kubelet will perform garbage collection for containers every minute and garbage collection for images every five minutes. If the “invocation duration” is high, kubelet is doing lots of GC and probably impacting the node performance.

eG Enterprise is an Observability solution for Modern IT. Monitor digital workspaces,
web applications, SaaS services, cloud and containers from a single pane of glass.
References
- Learn more about eG Enterprise monitoring for Kubernetes (Kubernetes Monitoring Tools for Top Performance | eG Innovations) and container technologies such as Docker (Docker Container Monitoring Tools | eG Innovations)
- Kubernetes – Wikipedia
- Kubernetes Documentation | Kubernetes (Includes comprehensive documentation explaining what is a “kubelet”, “namespace”, “pod” and so on
- An accessible starting point for understanding Kubernetes architectural features is – “The illustrated Children’s Guide to Kubernetes”, available on YouTube.
- Gilad David Maayan’s article overviewing some of the differences between the open-source Kubernetes project and the Red Hat OpenShift product: OpenShift vs. Kubernetes: The Seven Most Critical Differences
 Babu is Head of Product Engineering at eG Innovations, having joined the company back in 2001 as one of our first software developers following undergraduate and masters degrees in Computer Science, he knows the product inside and out. Based within our Singapore R&D Management team, Babu has undertaken various roles in engineering and product management becoming a certified PMP along the way.