You have management software that you’ve used for your Linux or Windows servers. Can’t you just deploy a Linux agent and monitor a VMware vSphere/ESX server (i.e., VMware Monitoring), or a Windows agent to monitor a Microsoft Hyper-V server?
 This is a very common question that comes up in any discussion on VMware monitoring and virtualization management. After all, when a VMware ESX server boots, the administrator gets to a Linux login prompt and can login to a Linux operating system. Likewise, for Microsoft Hyper-V, the administrator accesses a Windows server console.
In this blog, we will highlight why using a standard operating system monitoring tool may not be sufficient to monitor your VMware infrastructure well.
VMware Architecture is Different from a Standard OS |
Figure 1 shows the architecture of a Linux operating system. Windows, Solaris, AIX, etc. have similar architectures. The CPU, memory and I/O resources are available to the OS. Application/user processes run on the operating system. In an earlier blog, we had discussed key performance metrics that need to be monitored to track operating system health.
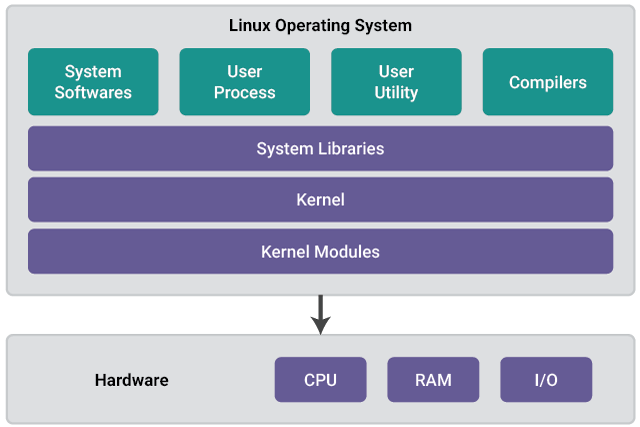
Figure 1: Architecture of a Linux operating system.
Figure 2 below shows the architecture of a VMware server. The virtualization layer allows multiple VMs to be hosted on the same physical hardware. CPU, memory, disk and network resources of the hardware are shared across all the VMs hosted on the server. Each of the VMs runs an operating system that in turn can support multiple operating systems.
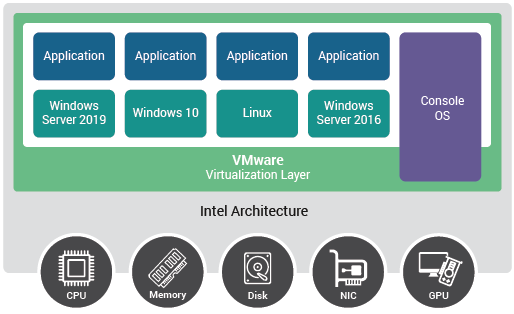 Figure 2: VMware vSphere/ESX architecture.
The virtualization layer, often referred to as the hypervisor, allows VMs to be created, deleted and executed on the server. This layer is responsible for ensuring that VMs get their fair share of the hardware resources available on the server. Operating system monitoring tools do not have the intelligence to monitor the virtualization layer.
Server OS Monitoring Tools Cannot Monitor VMware Virtualization |
A monitoring agent designed to monitor Linux cannot monitor a VMware ESX server, and an agent for Windows OS cannot monitor Microsoft Hyper-V. The Linux OS that you comes up when VMware ESX boots is the so-called Service Console (see Fig 2). The Service Console is a vestigial general-purpose operating system most significantly used as the bootstrap for the VMware kernel, vmkernel. Like other virtual machines on the ESX server, the service console is also another virtual machine (VM).
Any Linux operating system commands you execute on the service console only monitor activities in the service console VM. For example, when you run the “top” command on the service console, you are monitoring the top processes running in the service console. To monitor the VMware ESX hypervisor or the VMs running on the server, you need to run the “esxtop” command which is the management interface for the ESX server.
From the above discussion, it should be apparent that when you install a Linux monitoring agent on the service console, you are only monitoring the service console’s Linux OS and the applications running inside the service console. The virtualization platform is a much more complex system and if your monitoring system is not virtualization-aware, you will not get visibility into different aspects of the virtualization platform’s performance.
The case of Hyper-V is very similar. The root-partition of Hyper-V (the equivalent of the VMware ESX service console) runs a Windows operating system. A Windows monitoring agent installed on the root-partition can monitor this VM but will not be able to collect metrics about the hypervisor and the other VMs.
A Virtualization-aware Monitoring System Should be Able to Monitor: |
|---|

|
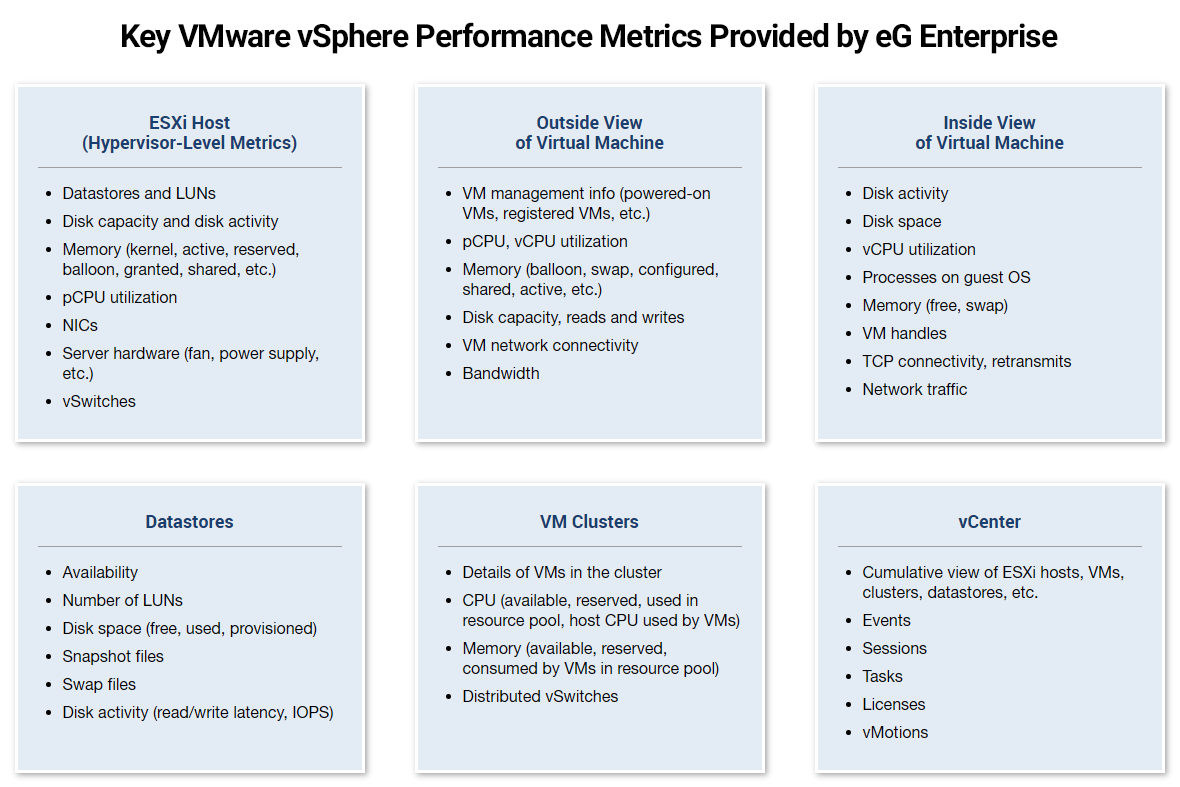
Key Performance Metrics for Monitoring VMware |
Below is a summary of the key performance metrics that you should look for in any VMware monitoring solution. Besides monitoring the VMware servers, the monitoring solution must also be able to monitor vCenter activity. For instance, administrators need to be alerted if live migration/vMotion of VMs is happening too frequently or is taking a long time. Likewise, if an ESX server stops responding to vCenter, it means that the administrator cannot control the server from the vCenter console. Proactive alerts need to be triggered for such anomalies.

eG Enterprise is an Observability solution for Modern IT. Monitor digital workspaces,
web applications, SaaS services, cloud and containers from a single pane of glass.