Performing Aggregation Using a Single Condition
The procedure detailed below takes the example a Citrix XenApp farm. Let us see how to define an aggregate test that will report the percentage of XenApp servers in the farm that have CPU utilization over 80%.
-
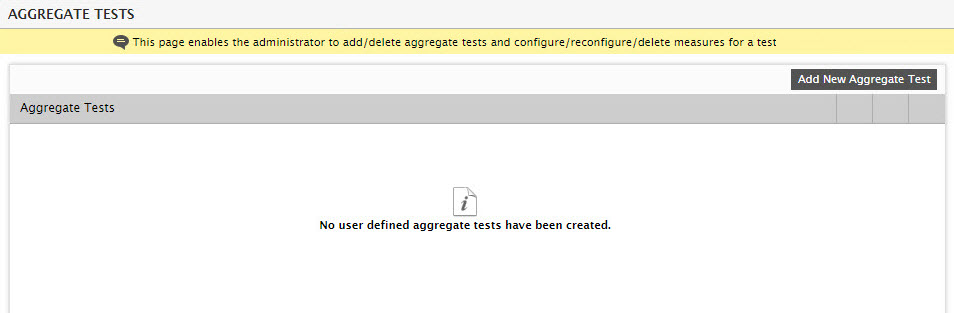
Select the Add/Modify Tests option from the Aggregates menu of the Infrastructure tile. Figure 1 then appears.
-
If no user-defined aggregate tests pre-exist, then Figure 1 will display a message to that effect. To add a new test, click the Add New Aggregate Test button in Figure 1. This will open Figure 2.
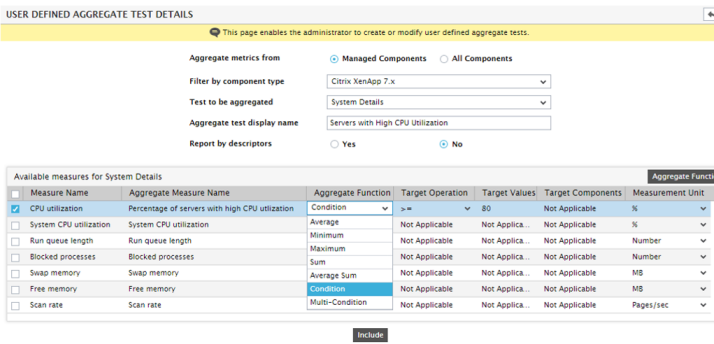
Figure 2 : Configuring an aggregate test using a single condition
- Set the Aggregate flag in Figure 2 to Managed Components.
- Pick Citrix XenApp 7.x as the component type from the Filter by component type list.
- Since the CPU usage measure of interest to us is reported by the System Details test, select System Details as the Test to be aggregated.
- Provide a meaningful display name for the new aggregate test in the Aggregate test display name text box.
- As aggregation is not descriptor-based in the case of our example, set the Report by descriptors flag to No.
- The Available measures section will then display all measures that are reported by the Test to be aggregated. Against every measure name, the Aggregate Measure Name set by default for that measure and the Aggregate Function that is applied by default when aggregating that measure will be displayed.
- Let us now focus on the CPU utilization measure. To aggregate the value of this measure based on a single condition, select the Condition option as the Aggregate Function for that measure.
- Once Condition is chosen as the Aggregate Function, five new columns get added to Figure 2. They are, namely – Target Operation, Target Values, Target Violation by Descriptors, Target Components, and Measurement Unit.
- From the Target Operation drop-down, select the logical function to define the Conditional Aggregation criteria. Our example seeks to report the percentage of XenApp servers in a farm that are utilizing 80% of the CPU resources or more. To achieve this, select the >= option from the Target Operation drop-down. Then, in the Target Values text area, specify the value to be checked against the operation chosen from Target Operation. Since the condition should check for a value >= 80%, specify 80 in the Target Values text area.
-
Since the Report by Descriptors flag is set to No, you will find an additional Target Violation by Descriptors column. This column offers the following options:
Option Purpose Majority If you select this option for the CPU utilization measure in our example, then the measure will report the percentage of only those server in the XenApp farm with a majority of their processors used 80% of the time or more.
All If you select this option for the CPU utilization measure in our example, then the measure will report the percentage of only those servers in the XenApp farm with all their processors used 80% of the time or more.
Any If you select this option for the CPU utilization measure in our example, then the measure will report the percentage of only those servers in the XenApp farm with at least one processor that is used 80% of the time or more.
Since the Majority option is what suits our purpose, select that for the CPU utilization measure in our example.
- The Target Components specification is not applicable to an aggregate test that is based on a single condition. So, let us move to the Measurement Unit.
- From the Measurement Unit drop-down, pick the unit in which the value of this aggregate measure is to be reported. For a single condition, the measurement unit can be Number or % only. As we want the aggregate measure in our example to report the percentage of servers that fulfill a specified condition, select% as the Measurement Unit.
- Then, select the check box corresponding to the CPU utilization measure and click the Include button to save the changes.
-
Next, switch to the Monitor interface to check what measure this aggregate test reports. Figure 3 depicts the value of the new aggregate measure. As is evident from Figure 3, 25% of the servers in the XenApp farm consume over 80% of CPU. To know which are these XenApp servers, click the
.png) icon corresponding to the measure name in Figure 3.
icon corresponding to the measure name in Figure 3. 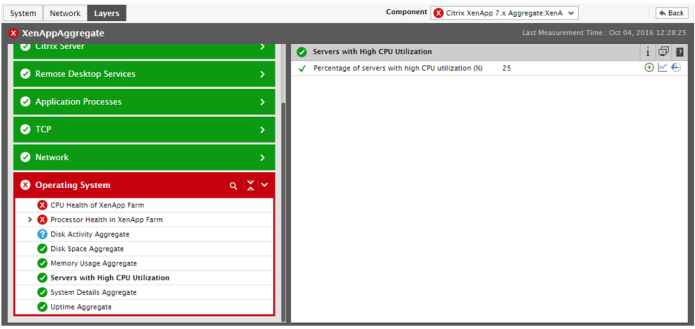
-
Figure 4 will then appear.
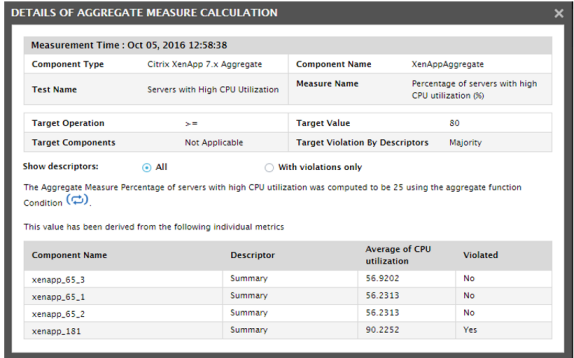
- Figure 4 describes how the value of the measure was computed. In the table at the bottom of Figure 4, you can see that the components in the XenApp farm have been listed. Against each component, the descriptors - i.e., the Processors - supporting the corresponding server will be listed. The percent CPU utilization of each processor will also be displayed alongside, with an indication as to whether/not that utilization value has violated the configured Target Value condition. In the case of our example, the System Details test of each of the XenApp servers in the farm reports metrics for the Summary descriptor only, and not for the individual processors. Therefore, the aggregate test also looks for violations in the Summary descriptor alone.
- As per our specification, a server in the farm is considered to have violated the target value of 80%, only if a Majority of its descriptors violates the configured Target Value. Since Summary is the only descriptor in our example, any server in the farm that reports a CPU usage summary of over 80% will be in violation of the Target Value. If you now look at the values in the Average of CPU utilization column in Figure 4, it will be clear to you that the CPU usage summary exceeds 80% in only 1 out of the 4 XenApp servers. In percentage, this count amounts to 25%. This is why, the Servers with High CPU utilization measure reports the value 25%.