Monitoring Apache Ignite
eG Enterprise offers a specialized monitoring model that monitors the Apache Ignite using targeted queries and sheds light on current or probable performance dips that the service might suffer.
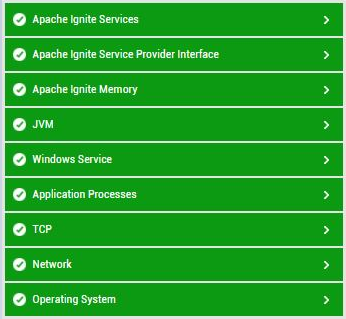
Figure 1 : Layer Model for Apache Ignite
Every layer of Figure 1 is mapped to a wide variety of tests that monitor critical performance parameters such as availability, workload, transaction performance of the core components of the service architecture. To pull out such useful performance data from the service, the eG agent uses JMX to connect to Ignite cluster and collect metrics.
The metrics so collected would enable administrators to find accurate answers for the following performance queries:
- What is the performance of cache in terms of time to read and write?
- How well is the job failover mechanism working?
- What is the percentage of cache hit against total number of get operations?
- How well the cache is backed up, if cache is failed, would data be lost?
- How well is rebalancing working, are the cache queries spread across the nodes?
- Is the transaction performance satisfactory, or are too many transactions failing?
- What is the status of data persistence, is there a lag between write and saving down to database?
- What is the percentage of active nodes against all nodes?
- What is the average job execution time on Ignite Cluster?
- What is the total physical memory allocated to on heap and off heap cache?
- What is the number of scheduled task and how many out of them have failed?
- How well is the communication between the nodes working, what is the rate of message transfers?
- Is the replication working optimally, what is amount of data replicated and how much is lag in replication process?
Since the Operating System, Application Processes, Windows Service and TCP layers have been elaborately discussed in Monitoring Unix and Windows Servers document, the tests mapped to the Network Layer have been elaborately discussed in Monitoring Cisco Router document, and the tests mapped to the JVM layer have already been discussed in Monitoring Java Applications document, the sections to come will discuss the other layers in detail.