Monitoring Apache Solr
eG Enterprise offers a special-purpose monitoring model for the Apache Solr to monitor the status and overall performance of the target Apache Solr.
Figure 1 depicts the layer model of an Apache Solr server.
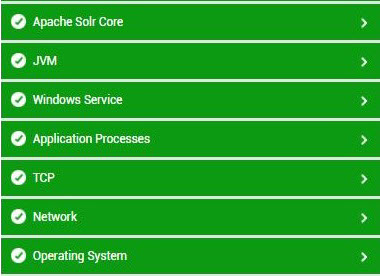
Figure 1 : Layer model for Apache Solr
Every layer in the Figure 1 is mapped to various tests to determine the critical statistics related to the performance of the target Apache Solr. Using the metrics reported by the tests, administrators can find accurate answers for the following performance queries:
- What is load on Apache Solr server indicated by number of requests per second?
- How many times requests have timed out or returned with partial results because of load on server?
- How many errors are encountered by handler?
- How well the cache is being used, total number of cache hits and misses?
- How many entries are there in cache and what is the total heap size of cache?
- Which handler has encountered maximum number of replication errors if replication is enabled?
- What is the number of replication errors encountered by client and server each?
- What is the number of replication requests?
- what is the number of update requests?
- How many client and server errors are encountered during update?
- Total number of partial updates because of timeouts?
- What is the total number of add requests after last commit?
- What is the total number of commits and how many of them are auto commits?
- Total number of uncommitted deletes, by id and by query?
- What is the number of documents which are pending commits?
Since the Operating System, Application Processes, Windows Service and TCP layers have been elaborately discussed in Monitoring Unix and Windows Servers document, the tests mapped to the Network Layer have been elaborately discussed in Monitoring Cisco Router document, and the tests mapped to the JVM layer have already been discussed in Monitoring Java Applications document, the sections to come will discuss the other layers in detail.