Monitoring Apache Zeppelin
eG Enterprise offers a special-purpose monitoring model for the Apache Zeppelin to monitor the status and overall performance of the target Apache Zeppelin.
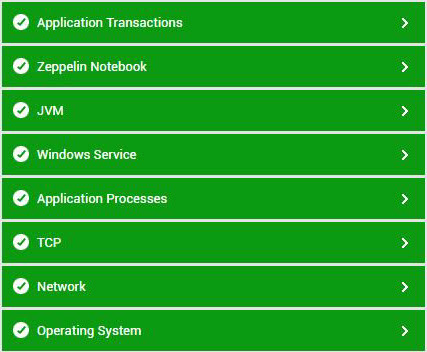
Figure 1 depicts the layer model of an Apache Zeppelin.

Figure 1 : Layer model for Apache Zeppelin
Every layer in the Figure 1 is mapped to various tests to determine the critical statistics related to the performance of the target Apache Zeppelin. Using the metrics reported by the tests, administrators can find accurate answers for the following performance queries:
-
How many Notebooks that currently exist in the target Apache Zeppelin?
-
How many paragraphs were executed in the Notebook of the target Apache Zeppelin during the last measurement period?
-
Are there any low count of paragraphs that were displaying the status as READY during the last measurement period?
-
Are there any low count of paragraphs that were displaying the status as FINISHED during the last measurement period?
-
Are there any high count of paragraphs that were displaying the status as ABORT during the last measurement period?
-
Are there any high count of paragraphs that were displaying the status as ERROR during the last measurement period?
-
Are there any high count of paragraphs that were displaying the status as PENDING during the last measurement period?
-
Are there any high count of paragraphs that were displaying the status as RUNNING during the last measurement period?
Since the Operating System, Application Processes, Windows Service and TCP layers have been elaborately discussed in Monitoring Unix and Windows Servers document, the tests mapped to the Application Transactions Layer have been elaborately discussed in Monitoring Business Transactions document, the tests mapped to the Network Layer have been elaborately discussed in Monitoring Cisco Router document, and the tests mapped to the JVM layer have already been discussed in Monitoring Java Applications document, the sections to come will discuss the other layers in detail.