Retrieving Problem Distribution of the Target Environment
Using the eG REST API, administrators can retrieve the alarm count based on severity for all component types, components, layers and tests specific to the target environment.
Retrieving Problem Distribution for all Component Types
URL: http://<eG manager IP:port>/api/eg/analytics/getProblemDistribution/servertype
Method: POST
Content-Type: application/json
| Parameters | Key values | Example |
|---|---|---|
|
Headers |
managerurl user pwd |
{ "timeline":"1 hour" } |
|
Body |
Default: { "timeline":"Timeline for retrieving the alarms (in hours/days/weeks)" } |
| Type | Code | Content |
|---|---|---|
|
JSON |
200 |
{ "Problem Distribution": [ { "componentType": "Citrix License", "critical": "18", "major": "12", "minor": "4" }, . . . } |
| Type | Code | Content |
|---|---|---|
|
JSON |
401 UNAUTHORIZED |
{"code": 401,"error": "Invalid username or password"} |
|
JSON |
400 BAD REQUEST |
You may receive one of the following responses: {"code": 400,"error": " Bad Request. Header parameters : Username or Password or Manager Url is missing"} (or) {"code": 400,"error": " Bad Request. Manager Url,Username,password is not provided"} (or) {"code": 400,"error": " Component type not associated with this user"} (or) {"code": 400,"error": "No components associated for this user"} (or) {"code": 400,"error": "Provide a space between value and unit in Timeline"} (or) {"code": 400,"error": "Invalid Timeline. Please refer EG REST API documentation for this API"} |
|
JSON |
500 Server Error |
{"code": 500,"error": " Server Error. Please check /manager/logs/error_log in the installation directory for more information"} |
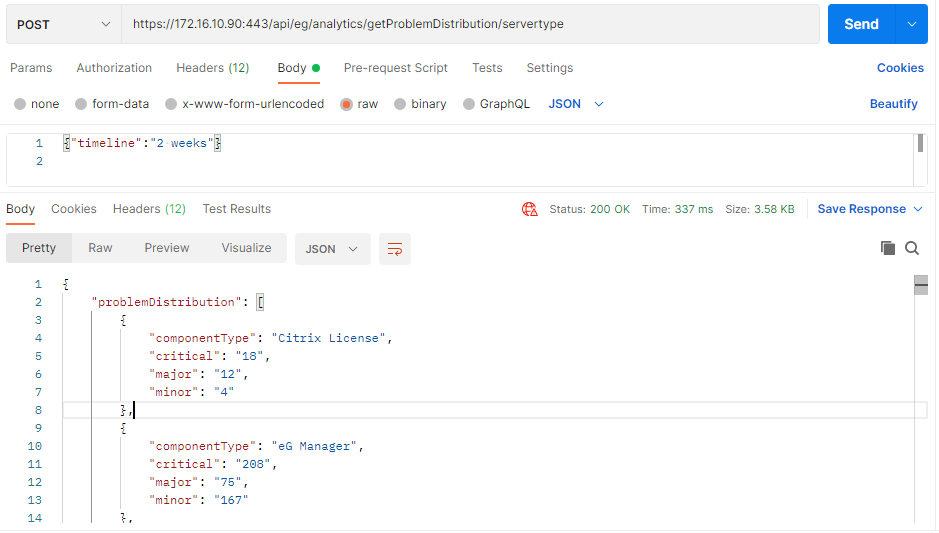
Figure 1 : Retrieving the alarm count based on severity for all component types using Postman REST Client
Retrieving Problem Distribution for all Component Types using cURL
To retrieve the alarm count based on severity for all component types managed in the target environment using cURL, the command should be specified in the following format:
curl -L -X POST "http://<eG Manager IP:Port>/api/eg/analytics/getProblemDistribution/servertype" -H "user:<eG username or domain/eG username>" -H "pwd:Base64 encoded password" -H "managerurl:http://<eG Manager IP:Port>" -H"Content-Type:application/json" --data-raw "{\"timeline\":\"Timeline for retrieving the alarms (in hours/days/weeks)\"}"
Figure 2 shows an example to retrieve the alarm count based on severity for all component types managed in the target environment using cURL.
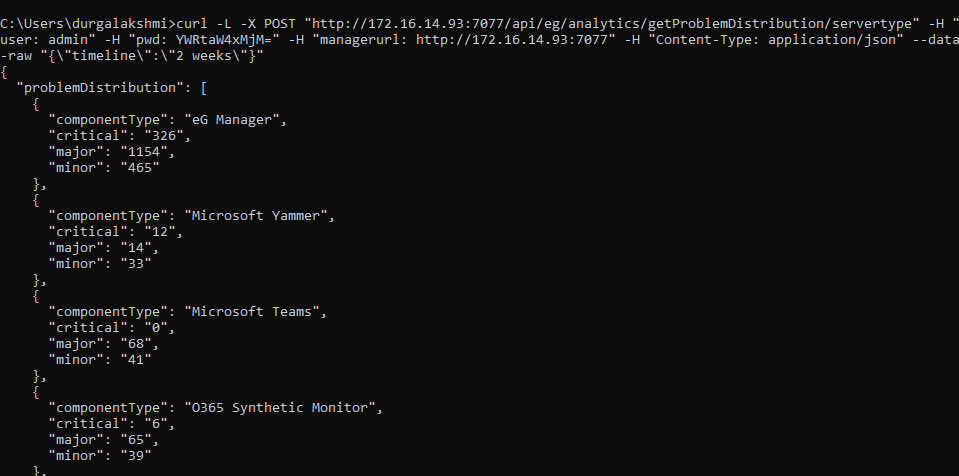
Figure 2 : Retrieving the alarm count based on severity for all component types using cURL
Retrieving Problem Distribution for all Components
URL: http://<eG manager IP:port>/api/eg/analytics/getProblemDistribution/servername
Method: POST
Content-Type: application/json
| Parameters | Key values | Example |
|---|---|---|
|
Header |
managerurl: Base URL of the eG Manager i.e., http://<IP address of the eG console:Port> user: eG username or domain/eG username pwd: Base64 encoded password |
{ "timeline":"1 hour" } |
|
Body |
Default: { "timeline":"Timeline for retrieving the alarms (in hours/days/weeks)" } |
| Type | Code | Content |
|---|---|---|
|
JSON |
200 |
{ "problemDistribution": [ { "componentName": "CTXCONNECTSRV", "critical": "8", "major": "0", "minor": "0" }, { "componentName": "MySQL_Cluster_10.87:3306", "critical": "0", "major": "0", "minor": "11" }, . . . } |
| Type | Code | Content |
|---|---|---|
|
JSON |
401 UNAUTHORIZED |
{"code": 401,"error": "Invalid username or password"} |
|
JSON |
400 BAD REQUEST |
You may receive one of the following responses: {"code": 400,"error": " Bad Request. Header parameters : Username or Password or Manager Url is missing"} (or) {"code": 400,"error": " Bad Request. Manager Url,Username,password is not provided"} (or) {"code": 400,"error": " Component type not associated with this user"} (or) {"code": 400,"error": "No components associated for this user"} (or) {"code": 400,"error": "Provide a space between value and unit in Timeline"} (or) {"code": 400,"error": "Invalid Timeline. Please refer EG REST API documentation for this API"} |
|
JSON |
500 Server Error |
{"code": 500,"error": " Server Error. Please check /manager/logs/error_log in the installation directory for more information"} |
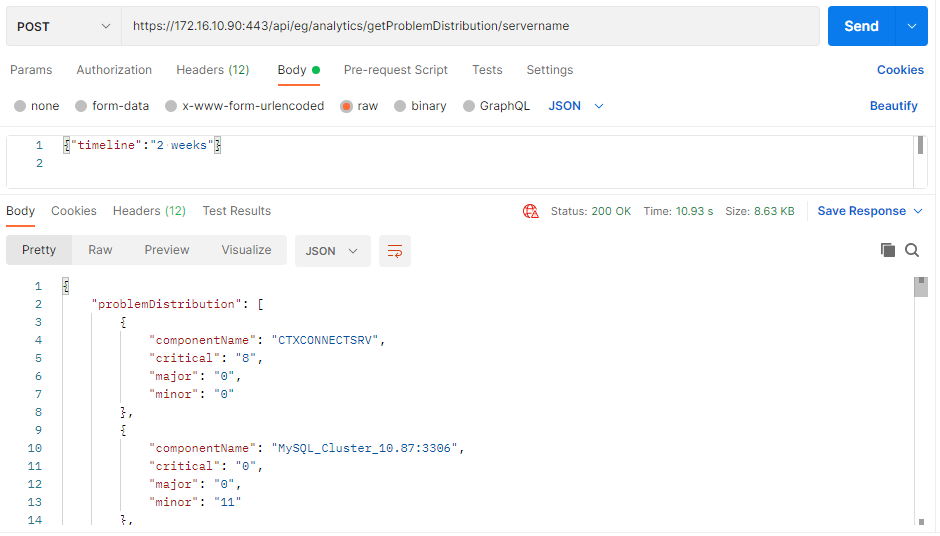
Figure 3 : Retrieving the alarm count based on severity for all components using Postman REST Client
Retrieving Problem Distribution for all Components using cURL
To retrieve the alarm count based on severity for all components managed in the target environment using cURL, the command should be specified in the following format:
curl -L -X POST "http://<eG Manager IP:Port>/api/eg/analytics/getProblemDistribution/servername" -H "user:<eG username or domain/eG username>" -H "pwd:Base64 encoded password" -H "managerurl:http://<eG Manager IP:Port>" -H"Content-Type:application/json" --data-raw "{\"timeline\":\"Timeline for retrieving the alarms (in hours/days/weeks)\"}"
Figure 2 shows an example to retrieve the alarm count based on severity for all components managed in the target environment using cURL.
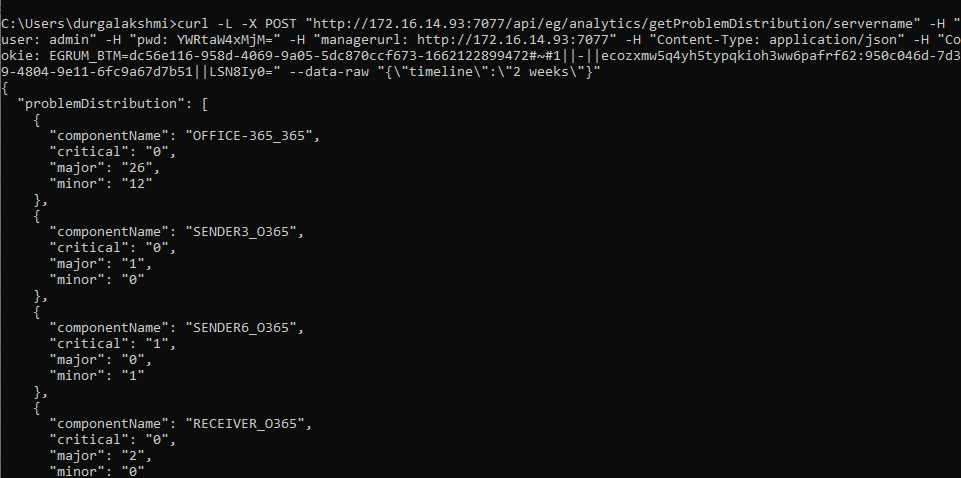
Figure 4 : Retrieving the alarm count based on severity for all components using cURL
Retrieving Problem Distribution of the Layers of a Component Type
URL: http://<eG manager IP:port>/api/eg/analytics/getProblemDistribution/layer
Method: POST
Content-Type: application/json
| Parameters | Key values | Example |
|---|---|---|
|
Headers |
managerurl: Base URL of the eG Manager i.e., http://<IP address of the eG console:Port> user: eG username or domain/eG username pwd: Base64 encoded password |
{ "timeline":"1 hour", componentType":"Microsoft Windows" } |
|
Body |
Default: { "timeline":"Timeline for retrieving the alarms (in hours/days/weeks)", "componentType":"Component Type" } |
| Type | Code | Content |
|---|---|---|
|
JSON |
200 |
{ "problemDistribution": [ { "layer": "Windows Service", "critical": "1", "major": "81", "minor": "78" }, . . . } |
| Type | Code | Content |
|---|---|---|
|
JSON |
401 UNAUTHORIZED |
{"code": 401,"error": "Invalid username or password"} |
|
JSON |
400 BAD REQUEST |
You may receive one of the following responses: {"code": 400,"error": " Bad Request. Header parameters : Username or Password or Manager Url is missing"} (or) {"code": 400,"error": " Bad Request. Manager Url,Username,password is not provided"} (or) {"code": 400,"error": " Component type not associated with this user"} (or) {"code": 400,"error": "No components associated for this user"} (or) {"code": 400,"error": "Provide a space between value and unit in Timeline"} (or) {"code": 400,"error": "Invalid Timeline. Please refer EG REST API documentation for this API"} |
|
JSON |
500 Server Error |
{"code": 500,"error": " Server Error. Please check /manager/logs/error_log in the installation directory for more information"} |
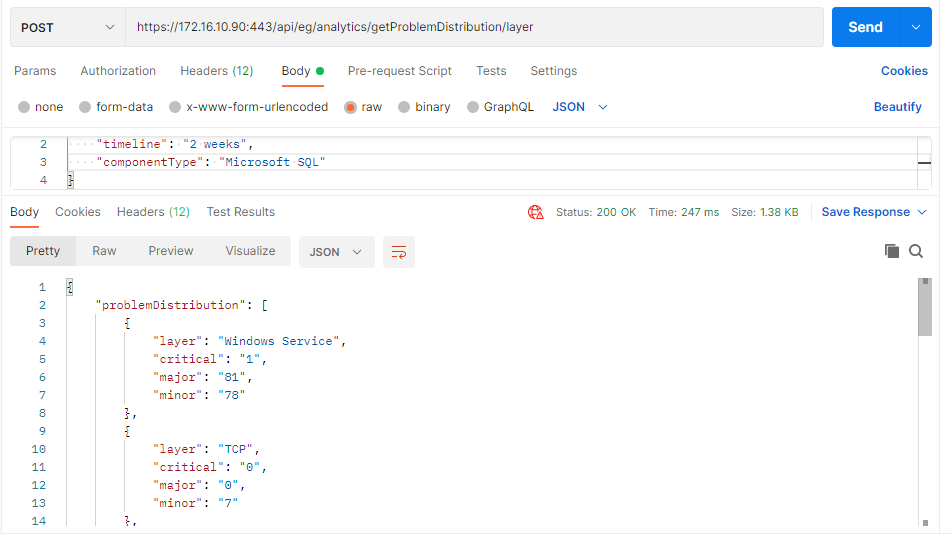
Figure 5 : Retrieving the alarm count based on severity for all layers of a Component Type using Postman REST Client
Retrieving Problem Distribution of the Layers of a Component Type using cURL
To retrieve the alarm count based on severity corresponding to all layers of a chosen Component Type managed in the target environment using cURL, the command should be specified in the following format:
curl -L -X POST "http://<eG Manager IP:Port>/api/eg/analytics/getProblemDistribution/layer" -H "user:<eG username or domain/eG username>" -H "pwd:Base64 encoded password" -H "managerurl:http://<eG Manager IP:Port>" -H "Content-Type:application/json" --data-raw "{\"timeline\":\"Timeline for retrieving the alarms (in hours/days/weeks)\",\"componentType\":\"Component Type\"}"
Figure 2 shows an example to retrieve the alarm count based on severity corresponding to all layers of a chosen Component Type managed in the target environment using cURL.
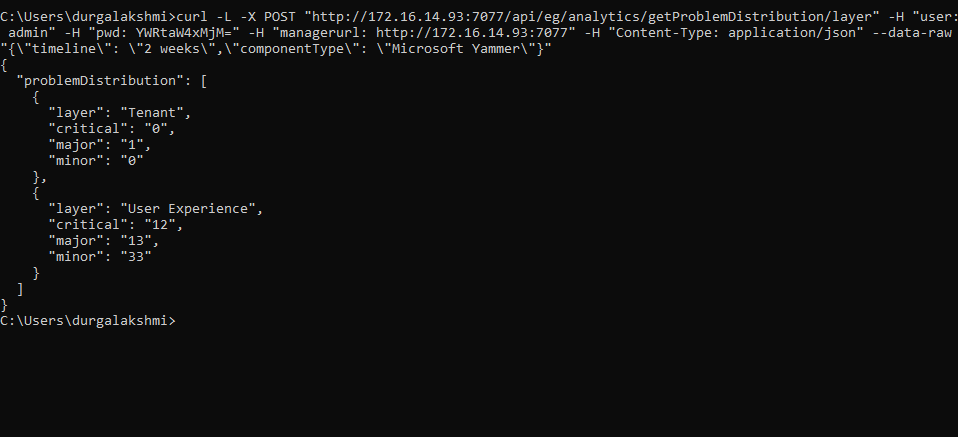
Figure 6 : Retrieving the alarm count based on severity for all layers of a Component Type using cURL
Retrieving Problem Distribution of the Tests of a Component Type
URL: http://<eG manager IP:port>/api/eg/analytics/getProblemDistribution/test
Method: POST
Content-Type: application/json
| Parameters | Key values | Example |
|---|---|---|
|
Headers |
managerurl: Base URL of the eG Manager i.e., http://<IP address of the eG console:Port> user: eG username or domain/eG username pwd: Base64 encoded password |
{ "timeline":"1 hour", "componentTtype":"Microsoft SQL" } |
|
Body |
Default: { "timeline":"Timeline for retrieving the alarms (in hours/days/weeks)", "componentType":"Component Type" } |
| Type | Code | Content |
|---|---|---|
|
JSON |
200 |
{ "problemDistribution": [ { "test": "Uptime", "critical": "0", "major": "0", "minor": "2" }, . . . } |
| Type | Code | Content |
|---|---|---|
|
JSON |
401 UNAUTHORIZED |
{"code": 401,"error": "Invalid username or password"} |
|
JSON |
400 BAD REQUEST |
You may receive one of the following responses: {"code": 400,"error": " Bad Request. Header parameters : Username or Password or Manager Url is missing"} (or) {"code": 400,"error": " Bad Request. Manager Url,Username,password is not provided"} (or) {"code": 400,"error": " Component type not associated with this user"} (or) {"code": 400,"error": "No components associated for this user"} (or) {"code": 400,"error": "Provide a space between value and unit in Timeline"} (or) {"code": 400,"error": "Invalid Timeline. Please refer EG REST API documentation for this API"} |
|
JSON |
500 Server Error |
{"code": 500,"error": " Server Error. Please check /manager/logs/error_log in the installation directory for more information"} |

Figure 7 : Retrieving the alarm count based on severity for all tests of a Component Type using Postman REST Client
Retrieving Problem Distribution of the Tests of a Component Type using cURL
To retrieve the alarm count based on severity for the tests of a chosen Component Type managed in the target environment using cURL, the command should be specified in the following format:
curl -L -X POST "http://<eG Manager IP:Port>/api/eg/analytics/getProblemDistribution/test" -H "user:<eG username or domain/eG username>" -H "pwd:Base64 encoded password" -H "managerurl:http://<eG Manager IP:Port>" -H"Content-Type:application/json" --data-raw "{\"timeline\":\"Timeline for retrieving the alarms (in hours/days/weeks)\",\"componentType\":\"Component Type\"}"
Figure 2 shows an example to retrieve the alarm count based on severity for all tests of a chosen Component Type managed in the target environment using cURL.
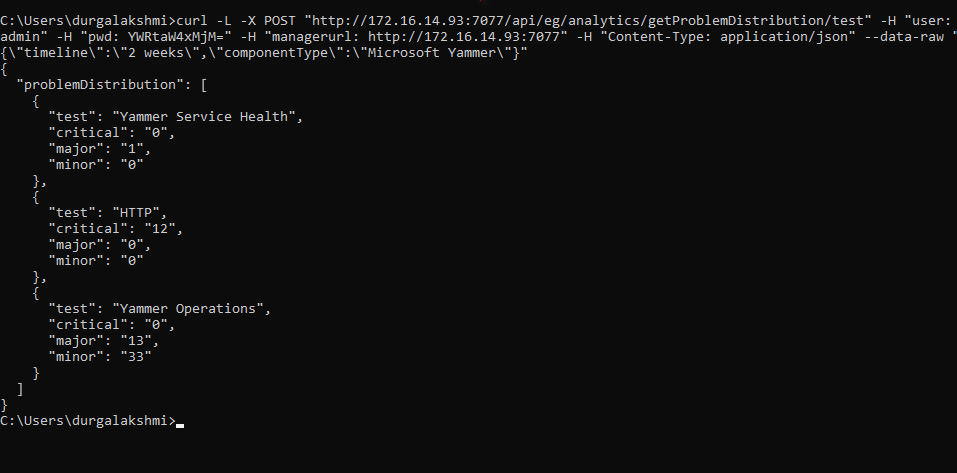
Figure 8 : Retrieving the alarm count based on severity for all tests of a Component Type using cURL