OS Details - AVD Test
This reports additional system-related metrics pertaining to the target Session Host.
Target of the test : An Azure Virtual Desktop
Agent deploying the test : An internal agent.
Outputs of the test : One set of results for the chosen session host
| Parameters | Description |
|---|---|
|
Test Period |
How often should the test be executed. |
|
Host |
The host for which the test is to be configured. |
|
Port |
The default port is NULL. |
|
Process Limit |
The Process Limit determines what type of processes are to be included in the detailed diagnosis of the Processes count measure of this test. By default, 5 is the Process Limit. This implies that the detailed diagnosis of the Processes count measure will by default list only those processes for which more than 5 instances are currently running on the target host. Processes with less than 5 currently active instances will not be displayed in the detailed diagnosis. This limit can be changed. |
|
Exclude Process |
If you want to exclude one/more processes from the detailed diagnosis of the Processes count measure, then specify a comma-separated list of processes to be excluded in the Exclude Process text box. By default, the svchost process is excluded from the detailed diagnosis of this test. |
|
Detailed Diagnosis |
To make diagnosis more efficient and accurate, the eG Enterprise embeds an optional detailed diagnostic capability. With this capability, the eG agents can be configured to run detailed, more elaborate tests as and when specific problems are detected. To enable the detailed diagnosis capability of this test for a particular server, choose the On option. To disable the capability, click on the Off option. The option to selectively enable/disable the detailed diagnosis capability will be available only if the following conditions are fulfilled:
|
| Measurement | Description | Measurement Unit | Interpretation |
|---|---|---|---|
|
Processes count |
Indicates the number of processes running on the virtual desktop. |
Number |
Use the detailed diagnosis of tthis measure to know which process has the maximum number of instances running currently. |
|
Threads count |
Indicates the number of threads in the virtual desktop. |
Number |
|
|
Registry quota in use |
Indicates the percentage of registry quota currently in use by the virtual desktop. |
Percent |
If this measure begins to reach 100%, we need to increase the total registry size set in Control Panel/System's Virtual Memory tab. |
|
Context switches |
This value is the combined rate at which all processors on the computer are switched from one thread to another. |
Switches/Sec |
Context switches occur when a running thread voluntarily relinquishes the processor, is preempted by a higher priority ready thread, or switches between user-mode and privileged (kernel) mode to use an Executive or subsystem service. If the context switch rate is unusually high, it implies that there is excessive contention for CPU resources. |
|
System calls rate |
This value is the combined rate of calls to operating system service routines by all processes running on the computer. |
Calls/Sec |
Operating system calls are used to perform all of the basic scheduling and synchronization of activities on the computer, and provide access to non-graphic devices, memory management, and name space management. Excessively high number of system calls can impact the performance of a system. Watch for processes that are issuing a large number of system calls. Applications corresponding to these processes could be candidates for performance optimizations. |
|
Pin read hits |
Indicates The percentage of pin read requests that hit the file system cache, i.e., did not require a disk read in order to provide access to the page in the file system cache. |
Percent |
While pinned, a page's physical address in the file system cache will not be altered. The LAN Redirector uses this method for retrieving data from the cache, as does the LAN Server for small transfers. This is usually the method used by the disk file systems as well. The pin read hits should be close to 100% for high performance. |
|
Pin read rate |
Indicates the frequency of reading data into the file system cache preparatory to writing the data back to disk. |
Reads/Sec |
Pages read in this fashion are pinned in memory at the completion of the read. While pinned, a page's physical address in the file system cache will not be altered. |
|
Interrupt time |
Indicates the percentage of time spent by the processor for receiving and servicing the hardware interrupts during the last polling interval. |
Percent |
This is an indirect indicator of the activity of devices that generate interrupts such as system Clocks, the mouse device drivers, data communication lines, network interface cards and other peripheral devices. In general, a very high value of this measure might indicate that a disk or network adapter needs upgrading or replacing. |
Use the detailed diagnosis of the Processes count measure to know which process has the maximum number of instances running currently.
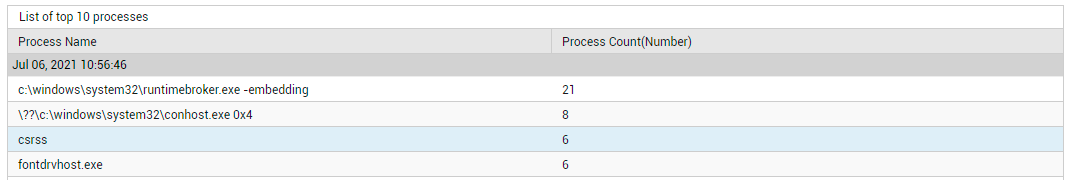
Figure 1 : The detailed diagnosis of the Processes count measure