System Details - AVD Test
This test collects various metrics pertaining to the CPU and memory usage of every processor supported by the chosen Session Host. The details of this test are as follows:
Target of the test : An Azure Virtual Desktop
Agent deploying the test : An internal agent.
Outputs of the test : One set of results for each processor on the chosen session host; an additional Summary descriptor will also appear for multi-processor desktops - this will report aggregate CPU and memory usage of the session host, across all processors.
| Parameters | Description |
|---|---|
|
Test Period |
How often should the test be executed. |
|
Host |
The host for which the test is to be configured. |
|
Port |
The default port is NULL. |
|
Detailed Diagnosis |
To make diagnosis more efficient and accurate, the eG Enterprise embeds an optional detailed diagnostic capability. With this capability, the eG agents can be configured to run detailed, more elaborate tests as and when specific problems are detected. To enable the detailed diagnosis capability of this test for a particular server, choose the On option. To disable the capability, click on the Off option. The option to selectively enable/disable the detailed diagnosis capability will be available only if the following conditions are fulfilled:
|
| Measurement | Description | Measurement Unit | Interpretation |
|---|---|---|---|
|
CPU utilization |
This measurement indicates the percentage of time the chosen virtual desktop used this processor. For the Summary descriptor, this measure will report the aggregate CPU usage of the virtual desktop, across all its processors. |
Percent |
A high value could signify a CPU bottleneck. The CPU utilization may be high because a few processes are consuming a lot of CPU, or because there are too many processes contending for a limited resource. The detailed diagnosis of this test reveals the top-10 CPU-intensive processes on the virtual desktop. |
|
System CPU utilization |
Indicates the percentage of time this processor was used for system-level processing. For the Summary descriptor, this measure will report the percentage of time the virtual desktop used all its processors for system-level processing. |
Percent |
An unusually high value indicates a problem and may be due to too many system-level tasks executing simultaneously. |
|
Run queue length |
Indicates the instantaneous length of the queue in which threads are waiting for the processor cycle. This length does not include the threads that are currently being executed. |
Number |
A value consistently greater than 2 indicates that many processes could be simultaneously contending for the processor. For multi-processor desktops, this measure is reported only for the Summary descriptor. |
|
Blocked processes |
Indicates the number of processes blocked for I/O, paging, etc. |
Number |
A high value could indicate an I/O problem on the guest (e.g., a slow disk). For multi-processor desktops, this measure is reported only for the Summary descriptor. |
|
Swap memory |
Denotes the committed amount of virtual memory. This corresponds to the space reserved for virtual memory on disk paging file(s). |
MB |
An unusually high value for the swap usage can indicate a memory bottleneck. Check the memory utilization of individual processes to figure out the process(es) that has (have) maximum memory consumption and look to tune their memory usages and allocations accordingly. For multi-processor desktops, this measure is reported only for the Summary descriptor. |
|
Free memory |
Indicates the free memory available. |
MB |
This measure typically indicates the amount of memory available for use by applications running on the target Azure virtual desktop. For multi-processor desktops, this measure is reported only for the Summary descriptor. |
|
Scan rate |
Indicates the memory scan rate. |
Pages/Sec |
A high value is indicative of memory thrashing. Excessive thrashing can be detrimental to desktop performance. For multi-processor desktops, this measure is reported only for the Summary descriptor. |
The detailed diagnosis capability of the CPU utilization measure, if enabled, provides a listing of the top 10 CPU-consuming processes (see Figure 1). In the event of a CPU bottleneck, this information will enable users to identify the processes/applications consuming a high percentage of CPU time and the users who are running these applications. Administrators can then advise such users to stop the resource-hungry processes/applications, so as to release the CPU resource for more important processing purposes.
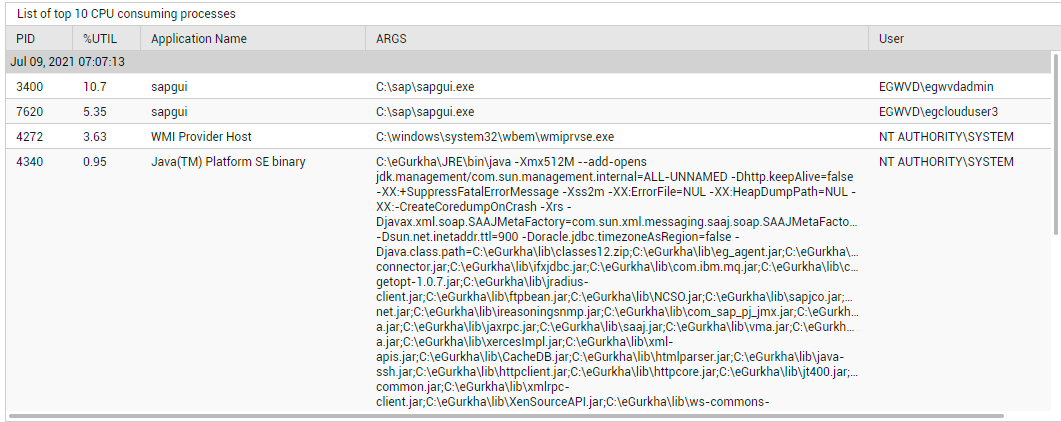
Figure 1 : Detailed diagnosis of the CPU utilization measure
Note:
While instantaneous spikes in CPU utilization are captured by the eG agents and displayed in the Measures page, the detailed diagnosis will not capture/display such instantaneous spikes. Instead, detailed diagnosis will display only a consistent increase in CPU utilization observed over a period of time.