Web HTTP Request Methods Test
Using the Web Devices test, administrators can identify which NetScaler appliance is handling bandwidth-intensive web traffic. To further investigate this anomaly, administrators may want to drill down to the individual request methods used in the HTTP requests to the appliance and understand how much bandwidth each method consumes. These method-level insights can help isolate the exact method that could be eating into the bandwidth resources available to the NetScaler. The Web HTTP Request Methods test provides these useful method-level insights. This test auto-discovers the HTTP request methods in use and reports the number of requests received and bandwidth used per method. In the process, the test points to the most popular and the most bandwidth-intensive HTTP request methods.
Target of the test : Citrix ADM Web Insight
Agent deploying the test : A remote agent
Outputs of the test : One set of results for every HTTP request method in use
| Parameter | Description |
|---|---|
|
Test period |
How often should the test be executed. It is recommended that you set the test period to 5 minutes. This is because, the Nitro API using which the eG agent collects metrics from Web Insight, is capable of capturing only the performance data related to the last 5 minutes. |
|
Host |
The host for which the test is to be configured. |
|
Insight Username, Insight password, and Confirm password |
To connect to Web Insight and collect the metrics it captures, the eG agent needs to be configured with the credentials of a user with read-only permissions to Web Insight. Type the name of this user against insight Username and the password of this user against Insight password. Then, confirm the password by retyping it in the Confirm password text box. |
|
SSL |
By default, Web Insight is not SSL-enabled. This is why, this flag is set to No by default. If it is SSL-enabled, then change this flag to Yes. |
|
DD Frequency |
Refers to the frequency with which detailed diagnosis measures are to be generated for this test. The default is 1:1. This indicates that, by default, detailed measures will be generated every time this test runs, and also every time the test detects a problem. You can modify this frequency, if you so desire. Also, if you intend to disable the detailed diagnosis capability for this test, you can do so by specifying none against DD Frequency. |
|
Detailed Diagnosis |
To make diagnosis more efficient and accurate, the eG Enterprise embeds an optional detailed diagnostic capability. With this capability, the eG agents can be configured to run detailed, more elaborate tests as and when specific problems are detected. To enable the detailed diagnosis capability of this test for a particular server, choose the On option. To disable the capability, click on the Off option. The option to selectively enable/disable the detailed diagnosis capability will be available only if the following conditions are fulfilled:
|
| Measurement | Description | Measurement Unit | Interpretation |
|---|---|---|---|
|
Hits |
Indicates the number of requests received by this ADM appliance using this HTTP request method. |
Number |
Compare the value of this measure across methods to know which method is the most popular. Use the detailed diagnosis of this measure to know the IP address and host name of the ADM appliance. |
|
Bandwidth |
Indicates the total amount of data received by this appliance using this HTTP request method. |
KB |
Compare the value of this measure across methods to know which HTTP request method is consuming bandwidth excessively. |
Use the detailed diagnosis of the Hits measure to know the IP address and host name of the ADM appliance.
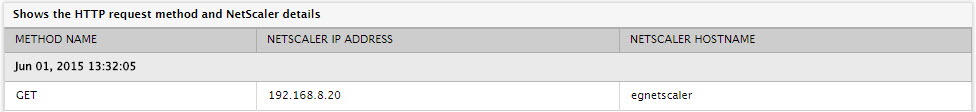
Figure 1 : The detailed diagnosis of the Hits measure of the HTTP Request Methods test