
How to Monitor NetScaler VPX/MPX Using eG Enterprise?
eG Enterprise can monitor the NetScaler VPX/MPX appliance in an agentless manner only. All that is required for this is an eG agent deployed on any remote Windows host. This agent collects performance metrics by invoking NITRO (NetScaler Interface Through Restful interfaces and Objects) APIs on the target appliance. Typically, the NITRO APIs can be invoked through the HTTP or the HTTPS mode.
To start NetScaler monitoring, add a NetScaler VPX/MPX component using the eG administrative interface and configure the tests to enable the eG agent to use the NITRO commands to fetch measures. The procedure for achieving this has been discussed in the following section.
Adding a Citrix NetScaler VPX/MPX Component
eG Enterprise cannot auto-discover a Citrix NetScaler VPX/MPX appliance. This implies that you need to manually add a Citrix NetScaler VPX/MPX component for monitoring using the eG administrative interface. The steps for manually adding the Citrix NetScaler VPX/MPX component are detailed below:
- Login to the eG admin interface.
- Click on the Add Component button in the right corner of the Components at a Glance page that appears or follow the Infrastructure -> Components -> Add/Modify menu sequence.
-
The Components page will then appear. In the Components page, select Citrix NetScaler VPX/MPX as the Component type and click the Add New Component button. Figure 1 will then appear.
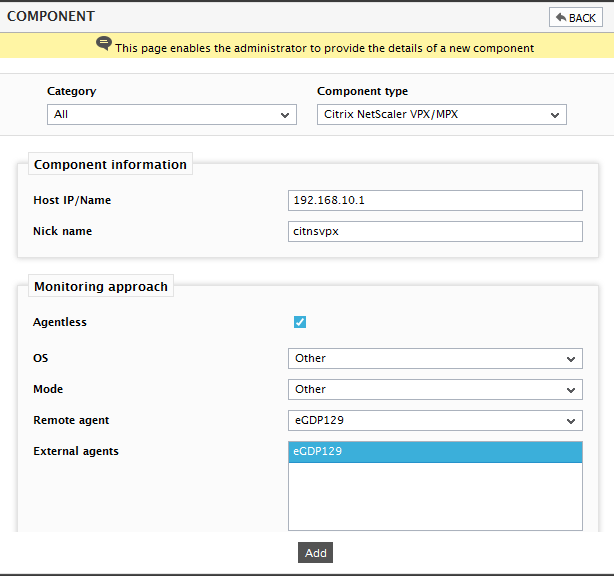
- Specify the Host IP/Name and the Nick name for the Citrix NetScaler VPX/MPX component.
- Since the appliance can be monitored only in an agentless manner, the Agentless flag will be switched on by default (see Figure 1).
- Select Other from the OS and Mode drop-down lists.
- Pick the Remote agent that will monitor the appliance. Similarly, select the External agent that will report the network availability and responsiveness of the appliance.
- Finally, click the Add button to add the appliance for monitoring.
-
Once the target component is added successfully, you will be again redirected to the Components page. Using the options provided in the Components page, you can modify, unmanage or delete the newly added component. In addition, you can also configure the tests, set thresholds and maintenance policies, and change the IP address.
-
To collect the performance metrics, you may need to manually configure the tests that are mapped to the Citrix NetScaler VPX/MPX component. To configure the tests that need manual configuration, click on the
 icon in the Components page. This will lead you to the Specific Test Configuration page where the unconfigured tests for the Citrix NetScaler VPX/MPX component will be listed in the Unconfigured Tests list box.
 - Configuring any one test for the target appliance will automatically configure all other tests associated with that appliance. So, click on any test in the in the Unconfigured Tests list box. For instance, click on the Application Firewall Violations test to configure it. To know how to configure the test, click here.
- Once all the tests are configured, switch to the Monitor tab to view the performance metrics.
