Monitoring Citrix XenApp Servers 4/5/6.x

In this section, we will be discussing the monitoring capabilities of the Citrix XenApp 4/5/6.x monitoring model alone. This model reveals the following:

XenApp Server Monitoring

  • Are the Citrix servers available to service user requests?
  • Are there sporadic disconnects from the Citrix server?
  • At what times do peak usage of the servers happen and is the server capacity adequate?
  • Is the user load being balanced across all the servers?
  • Is the data store available?
  • What are the access rates to the data store, the dynamic store, and the local host cache?
  • How much IMA traffic is happening between servers?

User Monitoring

  • What is the average response time that critical users are seeing when connecting to a XenApp server?
  • How many users are logged in to each server in the Citrix farm?
  • What is the resource usage (CPU and memory) for each user?
  • Are specific user profiles too large?

Operating System Monitoring

  • What is the average CPU and memory usage on all the servers in the farm?
  • Is any unusual memory scanning/paging activity happening on the systems?
  • Are the critical XenApp server and IMA processes up?
    What is their resource consumption?

Published Applications Monitoring

  • What are the published applications on a XenApp server?
  • Who is using each application?
  • What is the resource usage for each published application?

License Monitoring

  • How many product and connection licenses are available in the farm and what is their usage?
  • Are there enough licenses available for each of the published applications?

Infrastructure Services Monitoring

  • Is the web interface server forwarding requests to the XenApp server?
  • Are the backend databases working?
  • What is the resource usage of the databases?
  • Are users able to login to the server farm? How long is the login process taking?
  • What is the usage of the Microsoft Windows Domain Controller?

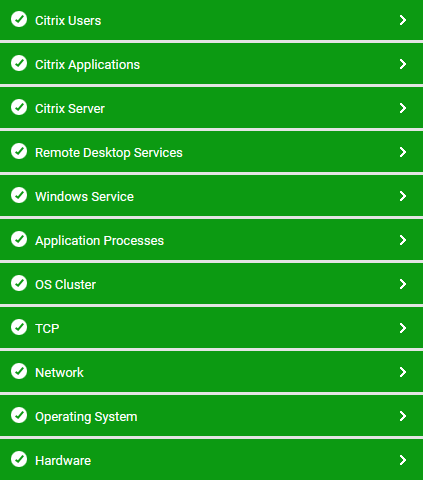
Figure 1 : Layer model of a Citrix XenApp server 4/5/6.x

The sections to come elaborate on the tests executing on the Operating System layer and each of the top 6 layers of the monitoring model depicted by Figure 1, and the measures they report.