LPAN Details Test
A Logical Processing Area Network (LPAN) is a collection of PAN resources — pNodes, virtual storage and network resources — that are allocated as a group. You use PAN Manager software to configure these resources into one or more pServers. Typically, an LPAN represents the computing resources that are devoted to a single purpose or organization.
This test auto-discovers the LPANs in the Egenera PAN Manager and reports the current status of this LPAN. This test helps the administrators to analyze the following:
- the average CPU Utilization of this LPAN;
- How many pServers and pNodes are available in this LPAN and how many pServers are currently booting, shutting down etc.?
- What are the global pools and the local pools that are linked to the LPAN?
- How many network resources like MAC address, WWNs and physical resources like vSwitch are attached to this LPAN?
Target of the test : An Egenera PAN Manager
Agent deploying the test : A remote agent
Outputs of the test : One set of results for each LPAN in a PAN domain.
| Parameter | Description |
|---|---|
|
Test Period |
How often should the test be executed. |
|
Host |
The IP address of the Egenera PAN Manager for which this test is to be configured. |
|
PAN Manager User, PAN Manager Password, and Confirm Password |
To monitor the Egenera PAN Manager, the eG agent has to be configured with administrator privileges. This is why, you need to specify the credentials of an administrator against the PAN Manager User and PAN Manager Password parameters of this test. Confirm the pan manager password by retyping it in the Confirm Password text box. |
|
SSL |
By default, the Egenera PAN Manager is not SSL-enabled. Accordingly, the SSL flag is set to No by default. |
|
PAN Manager Webport |
By default, in most environments, the Egenera PAN Manager listens on port 80 (if not SSL-enabled) or on port 443 (if SSL-enabled) only. This implies that while monitoring the Egenera PAN Manager, the eG agent, by default, connects to port 80 or 443, depending upon the SSL-enabled status of Egenera PAN Manager - i.e., if Egenera PAN Manager is not SSL-enabled (i.e., if the SSL flag above is set to No), then the eG agent connects to Egenera PAN Manager using port 80 by default, and if Egenera PAN Manager is SSL-enabled (i.e., if the SSL flag is set to Yes), then the agent-Egenera PAN Manager communication occurs via port 443 by default. Accordingly, the PAN Manager Webport parameter is set to default by default. In some environments however, the default ports 80 or 443 might not apply. In such a case, against the PAN Manager Webport parameter, you can specify the exact port at which the Egenera PAN Manager in your environment listens, so that the eG agent communicates with that port for collecting metrics from the Egenera PAN Manager. |
|
Detailed Diagnosis |
To make diagnosis more efficient and accurate, the eG Enterprise embeds an optional detailed diagnostic capability. With this capability, the eG agents can be configured to run detailed, more elaborate tests as and when specific problems are detected. To enable the detailed diagnosis capability of this test for a particular server, choose the On option. To disable the capability, click on the Off option. The option to selectively enabled/disable the detailed diagnosis capability will be available only if the following conditions are fulfilled:
|
| Measurement | Description | Measurement Unit | Interpretation | ||||||
|---|---|---|---|---|---|---|---|---|---|
|
Is Lpan active? |
Indicates the current status of this LPAN in the PAN Manager. |
|
This measure reports the value Yes if this LPAN is active in the PAN MAnager and the value No if this LPAN is not active. The numeric values that correspond to the above-mentioned measure values are as follows:
Note: By default, this measure reports the above-mentioned Measure Values while indicating the status of this LPAN. However, in the graph of this measure, the LPAN status will be represented using the corresponding numeric equivalents i.e., 0 or 1. |
||||||
|
Average CPU utilization |
Indicates the percentage of CPU utilized by this LPAN on an average |
Percent |
A low value is desired for this measure. A high value of this measure may indicate a performance bottleneck. |
||||||
|
Total pServers |
Indicates the number of pServers available in this LPAN. |
Number |
A pServer is a combination of a single pNode, an optional failover pNode, storage and network connections, that provides the capabilities of a conventional server. The detailed diagnosis of this measure lists out the all the pServers available in this LPAN. |
||||||
|
Booting pServers |
Indicates the number of pServers that are currently booting in this LPAN. |
Number |
|
||||||
|
Booted pServers |
Indicates the number of pServers that were already booted in this LPAN. |
Number |
|
||||||
|
Shutting pServers |
Indicates the number of pServers that are currently shutting down in this LPAN. |
Number |
|
||||||
|
Shutdown pServers |
Indicates the number of pServers that were already shut down in this LPAN. |
Number |
|
||||||
|
Failing pServers |
Indicates the number of pServers that are currently failing in this LPAN. |
Number |
|
||||||
|
pNodes |
Indicates the number of pNodes that are currently available in this LPAN. |
Number |
A pNode is nothing but a physical blade server that provides the CPU processing and memory capabilities for a pServer. The detailed diagnosis of this measure lists out the name of the pNodes available in this LPAN. |
||||||
|
Linked global pools |
Indicates the number of global pools that are currently attached to this LPAN. |
Number |
A global pool is a pNode Pool that is used by the whole PAN, from which pNodes are made available to pServers running in the PAN. A global pool spans LPANs i.e., the pNodes in a global pool can be made available to pServers running in any LPAN. The detailed diagnosis of this measure lists out the names of the global pools in this LPAN, the available number of pNodes in each global pool, indicates whether the pServer is capable of booting from this global pool and the name of the local pool that is linked to this global pool. |
||||||
|
Local pools |
Indicates the number of local pools that are currently attached to this LPAN. |
Number |
A local pool is a set of processing resources used by a specific LPAN and from which pNodes can be assigned to pServers running in that LPAN. The pNode in a local pool cannot be assigned to pServers running in other LPANs. Administrators can link a local pool to a Global Pool, so the PAN Manager will attempt to allocate a pNode from the global pool if it cannot obtain one from the local pool. The detailed diagnosis of this measure lists out the names of the local pool, the number of pNodes that are currently available in each local pool and the name of the global pool that this local pool is linked to. |
||||||
|
vSwitches |
Indicates the number of vSwitches that are currently attached to this LPAN. |
Number |
The detailed diagnosis capability of this measure if enabled, lists out the names of the vSwitches and the type of each vSwitch. |
||||||
|
Media images |
Indicates the number of media images that are currently attached to this LPAN. |
Number |
Media images can be used for a variety of purposes such as installing pServer PAN Tools, installing pServer operating systems, and providing software to the pServers in an LPAN. |
||||||
|
WWNs |
Indicates the number of WWNs (WORLD WIDE NAMEs) that are curently assigned to this LPAN. |
Number |
THE WORLD WIDE NAME (WWN) is a hardware address that uniquely identifies a target in a Storage Area Network (SAN). In PAN Manager, you assign WWNs to LPANs after which you use a vHBA to assign WWNs to a pServer. |
||||||
|
MACs |
Indicates the number of MAC (MEDIA ACCESS CONTROL) addresses that are curently assigned to this LPAN. |
Number |
The Media Access Control (MAC) Address is a hardware address that uniquely identifies a component in an Ethernet network. In PAN Manager, each pServer vNIC has a unique MAC address. |
The detailed diagnosis of the Local pools measure lists out the names of the local pool, the number of pNodes that are currently available in each local pool and the name of the global pool that this local pool is linked to.
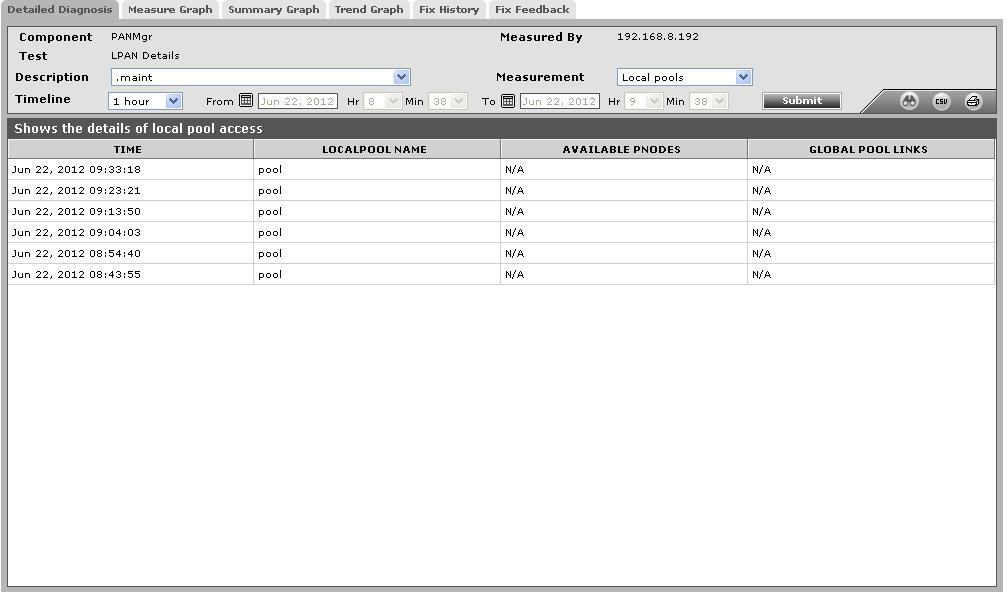
Figure 1 : The detailed diagnosis of the Local pools measure
The detailed diagnosis capability of the vSwitches measure if enabled, lists out the names of the vSwitches and the type of each vSwitch.
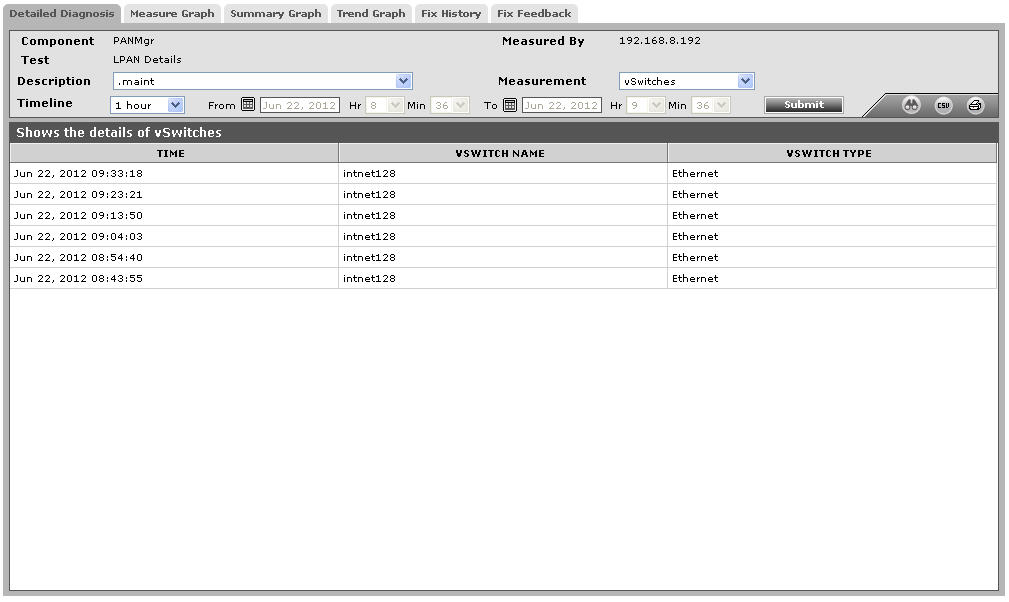
Figure 2 : The detailed diagnosis of the vSwitches measure