Monitoring the Egenera PAN Manager
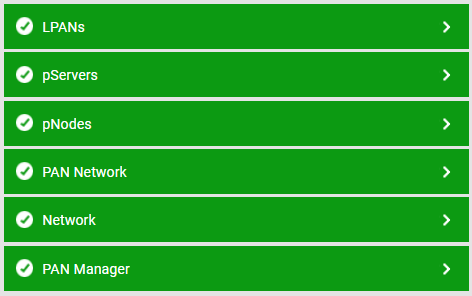
eG Enterprise offers a specialized Egenera PAN Manager monitoring model that monitors the current state and operations of each of the core components of the PAN manager, and reports anomalies instantly.

Figure 1 : The layer model of the Egenera PAN Manager
Using agentless mechanisms, the eG data collector executes the PAN Manager Web Server API commands on the PAN manager and collects a wide variety of performance statistics from the PAN manager. With the help of these statistics, administrators can find quick and accurate answers for the following queries:
- Is the PAN domain available currently?
- Are the pNodes in the PAN domain over-utilized?
- How many pNodes are available in the PAN manager? What are the names of the pNodes?
- How many global pools and uplinks are available in this PAN manager, and what are they?
- Have any media images, MACs, and WWNs been allocated to the PAN manager?
- Is the PAN OPServer currently available?
- How is license usage on the PAN Manager? Is any type of license nearing exhaustion? If so, which is it?
- Is any switch in the PAN domain powered off currently? If so, in which chassis is the switch available?
- Which switch in which chassis is attached to the maximum number of uplink ports? What are these uplink ports?
- How many vSwitches are there in the PAN Network, and what are they?
- On which vSwitch is link dependency not enabled?
- Is any pNode in the powered off state currently?
- Is any zone/hardware component of any pNode experiencing abnormal spikes in temperature? If so, which zone/hardware is it is it - is it the CPU, memory, DIMM, blade, hard drive, the Mezz zone, the CNA zone, the system zone, or the NIC zone - and which pNode are they associated with?
- Is any pServer in the shutdown mode currently?
- Is the PAN agent not available on any pServer?
- Is any pServer in the unmanaged or unavailable mode currently?
- Which pServer is currently experiencing high levels of disk I/O?
- Which pServer is consuming CPU excessively, and what is causing it - user-level processing or system-level processing?
- Is any pServer highly memory-intensive?
- Which pServer is consuming the maximum network bandwidth?
- Is any disk partition of a pServer running out of space? If so, which disk partition is it and which pServer is it associated with?
- Are there any inactive LPANs in the PAN manager?
- Is any LPAN CPU-hungry?