Monitoring the Hitachi USP
eG Enterprise offers a specialized Hitachi USP SAN model that monitors the Hitachi USP device inside-out, and promptly alerts administrators to issues affecting their performance, so that the required remedial action can be taken before its too late.
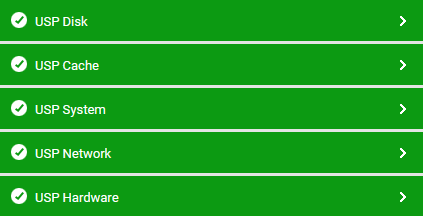
Figure 1 : The layer model of the Hitachi USP storage device
Once the pre-requisites discussed in Pre-requisites for Monitoring the Hitachi USP SAN are fulfilled, the eG agent will be able to collect the desired metrics from the USP device; these metrics enable administrators to find quick and accurate answers to the following performance queries:
- Is the storage device available over the network?
- Are the critical hardware components of the device, such as – battery, cache, controller, drive, fan, processor, power supply, shared memory - are operating normally?
- Are all the RAID stores of the USP device functioning without a glitch? Is any RAID store experiencing a hardware failure currently? Which RAID store is it, and which is the hardware component that is malfunctioning - is it the battery, the fan, the processor, cache, drive, shared memory, or power supply point?
- Is I/O load balanced across all the ports in SAN environment? Has any port been over-used? Which port is slow in responding to I/O requests?
- Are the channel, disk, and DRR processors on the storage device being utilized optimally?
- Do the caches have adequate memory space for storing data written to them, or are are too manywrites pending to the cache?
- How are the cache memory to cache switch access paths utilized? Is any path choking currently?
- Is the I/O load uniformly balanced across the logical volumes, LUNs, and parity groups on the storage device? Are any of these components over-utilized currently? Which one is it?