Setting Instrumentation Levels
The resources in a WebSphere administrative domain are instrumented so that statistical data can be collected. Instrumentation refers to the mechanism by which some aspect of the running system is measured. Each resource category has an instrumentation level that determines which measurements are available to be collected for that category.
Before you commence monitoring of WebSphere Application servers, the instrumentation levels of resource categories need to be set.
To do so, follow the steps given below:
- In the Administrative Console, highlight your application server.
-
Then, from the series of tabs listed in the right pane, select Services as shown in Figure 1.
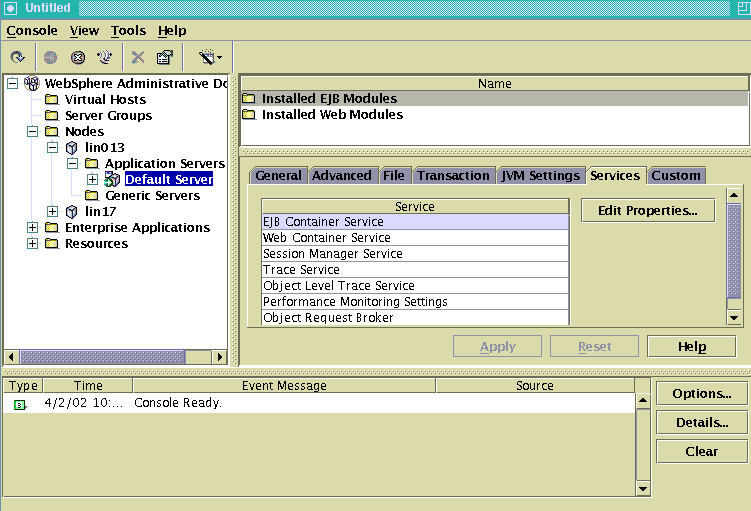
Figure 1 : Selecting the Services tab for the application server
-
From the Services displayed therein, choose Performance Monitoring Settings and click the Edit Properties… button as depicted by Figure 2.
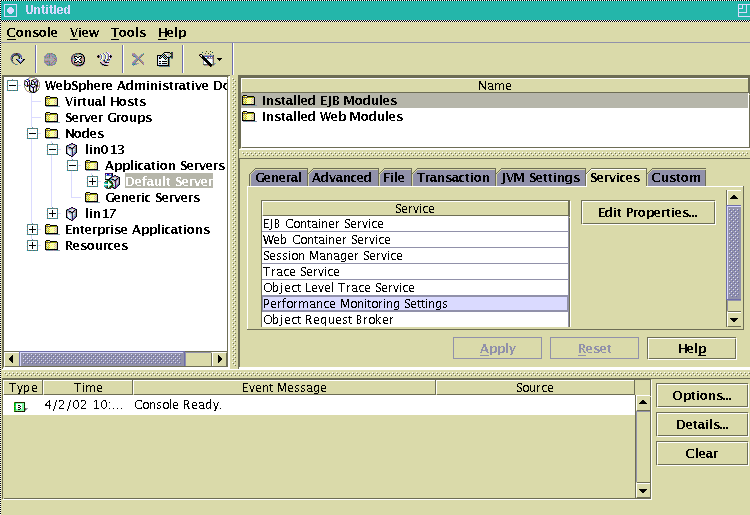
Figure 2 : Selecting the Performance Monitoring Settings service
-
Doing so, will reveal the following dialog box:
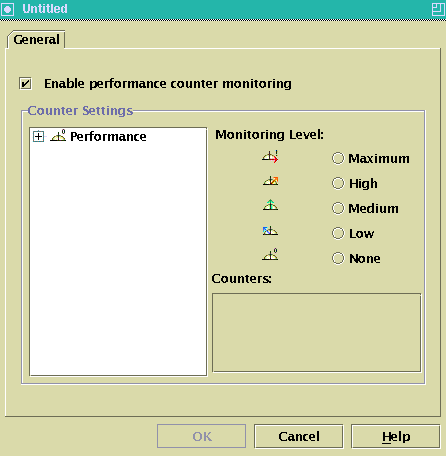
Figure 3 : Editing the performance monitoring settings
-
Expanding the Performance node here will bring to light the resource categories whose performance can be instrumented (see Figure 4). To instrument a resource category, select it and then choose High as the Monitoring Level of the same. This ensures that all the key measurements are collected.
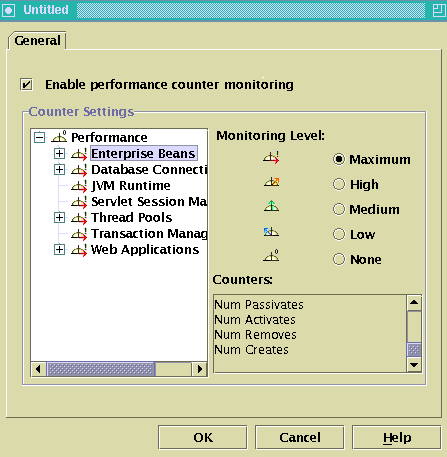
- Choosing “High” as the monitoring level is a must for eG to Monitor your WebSphere Application Server.