Container Performance Test
Kubernetes container performance hinges on efficient resource allocation, scaling, and management. Containers are lightweight and offer isolation, but their performance depends on factors like CPU, memory, and I/O limits set in Kubernetes. Properly configuring resource requests and limits ensures fair distribution and prevents bottlenecks. Kubernetes features like Horizontal Pod Autoscaler (HPA) and Cluster Autoscaler help dynamically adjust resources based on demand, optimizing performance. Additionally, Kubernetes manages container networking and storage, which impact latency and throughput. Regular monitoring using tools like Prometheus and Grafana helps identify and address performance issues, ensuring containers run efficiently and reliably in a scalable manner.
The Container Performance test continuously monitors the containers, and reports the key performance metrics like CPU Usage, CPU time used, Memory Usage, Disk usage etc.These metrics provide a clear picture of view of performance of underlying infrastructure and directly co-relate to performance of the application running on containers. These metrics help administrators analyze the root cause of performance and help them re mediate it before the application performance suffers.
Target of the test : A Kubernetes Worker Node
Agent deploying the test : An internal agent
Outputs of the test : One set of results for each container in the target Kubernetes Worker node being monitored
|
Parameter |
Description |
|---|---|
|
Test Period |
How often should the test be executed. |
|
Host |
The IP address of the host for which this test is to be configured. |
|
Port |
Specify the port at which the specified Host listens. By default, this is 6443. |
|
Use Sudo |
By default, the eG agent does not require any special permissions to parse and read messages from the log file to be monitored. This is why, the Use Sudo parameter is set to No by default. In some highly-secure Unix environments however, the eG agentinstall user may not have the permission to read the log file to be monitored. In such environments, you will have to follow the steps below to ensure that the test is able to read the log file and report metrics: Edit the SUDOERS file on the target host and append an entry of the following format to it: <eG_agent_install_user> ALL=(ALL) NOPASSWD: <Log_file_with_path> For instance, if the eG agent install user is eguser, and the log file to be monitored is /usr/bin/logs/procs.log, then the entry in the SUDOERS file should be: eguser ALL=(ALL) NOPASSWD: /usr/bin/logs/procs.log Finally, save the file. Then, when configuring this test using the eG admin interface, set the Use Sudo parameter to Yes. Once this is done, then every time the test runs, it will check whether the eG agent install user has the necessary permissions to read the log file. If the user does not have the permissions, then the test runs the sudo command to change the permissions of the user, so that the eG agent is able to read from the log file. |
|
Detailed Diagnosis |
To make diagnosis more efficient and accurate, the eG Enterprise embeds an optional detailed diagnostic capability. With this capability, the eG agents can be configured to run detailed, more elaborate tests as and when specific problems are detected. To enable the detailed diagnosis capability of this test for a particular server, choose the On option. To disable the capability, click on the Off option. The option to selectively enable/disable the detailed diagnosis capability will be available only if the following conditions are fulfilled:
|
|
Measurement |
Description |
Measurement Unit |
Interpretation |
|---|---|---|---|
|
CPU Usage |
Indicates the CPU usage of the node on which containers are executing. |
Percentage |
If the CPU usage is high, you may need to analyze and ensure the unwanted processes are not consuming CPU. |
|
CPU time used |
Indicates the CPU time used of the node on which containers are executing. |
Percentage |
|
|
Memory usage |
Indicates the memory usage of the node on which containers are executing. |
MB |
If the Memory usage is high, you may need to analyze and ensure the unwanted processes are not consuming Memory. |
|
Disk Usage |
Indicates the disk usage of the node on which containers are executing. |
MB |
|
|
Total Nodes |
Indicates the total number of nodes. |
Number |
|
|
Restarts |
Indicates the number of restarts of the nodes ever since the node is setup. |
Number |
|
|
OOM events |
Indicates the total number of OOM events. |
Number |
|
The detailed diagnosis of the CPU Usage measure reveals the PID, Percentage CPU utilization and Arguments.
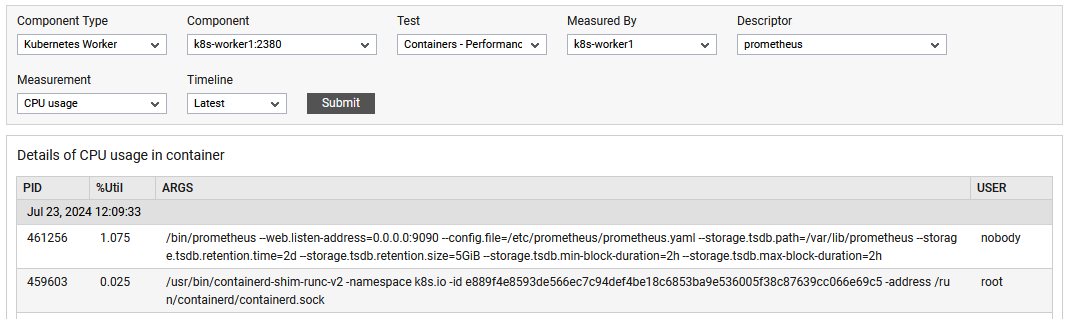
Figure 1 : The detailed diagnosis of the CPU usage measure
The detailed diagnosis of the Memory Usage measure reveals the PID, Percentage Memory utilization and Arguments.

Figure 2 : The detailed diagnosis of the Memory usage measure